 United States
It is often said that fashion follows a 20-year cycle. Indeed, emerging markets enjoyed a decade-long boom during the 2000s before falling largely out of favour. Today, they are back in the spotlight.
After three years of net outflows, investment flows into emerging market (EM) strategies were positive in 2025.1 Around half of the US$60bn net inflow was allocated to EM fixed income. Investor interest has surged in early 2026 following strong performance last year, when EM corporate debt was one of the best performing fixed income sectors, returning 8.7%, hedged to US dollars.2
We believe that this return to favour is justified for five reasons: strong credit fundamentals, compelling relative yields, technical tailwinds, diversification potential and positive macroeconomic conditions.
While the risks inherent in EM debt investing require a selective approach, it is our conviction that these factors combine to support the case for an asset class that continues to offer an unjustified ‘EM premium’.
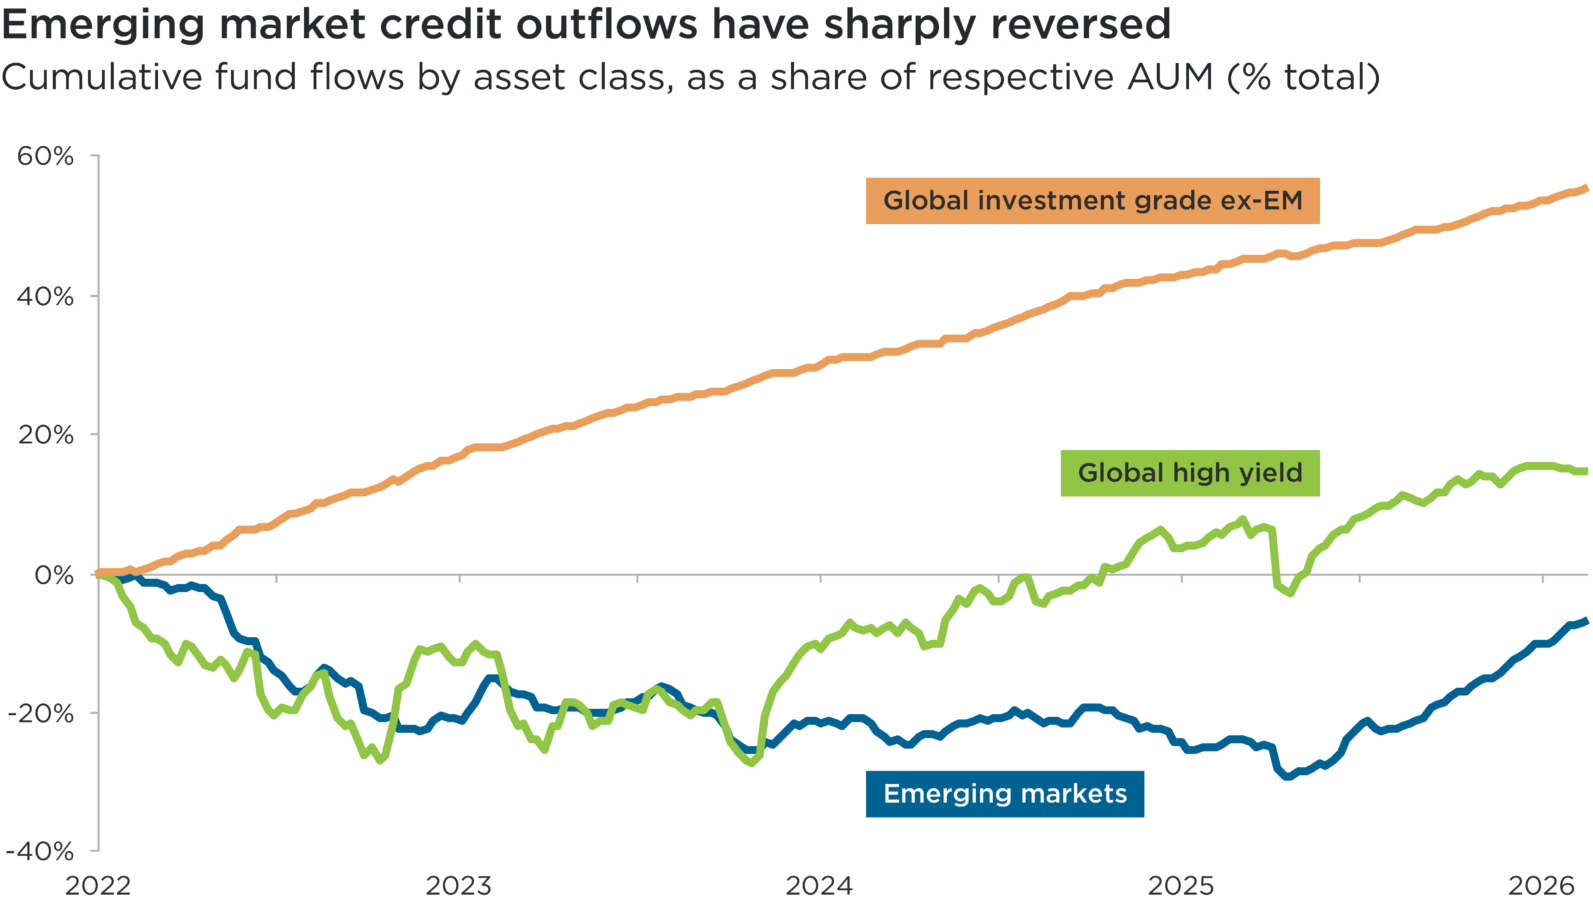
Source: JP Morgan, 20 February 2026. Based on assets under management (AUM) at the end of 2021.
Subhead: Cumulative fund flows by asset class, as a share of respective AUM (% total)
Overview: This line chart compares the cumulative fund flows into three asset classes between 29 December 2021 and 18 February 2026. The three asset classes, as represented by each respective line, are: global investment grade credit (excluding emerging markets); global high yield; and emerging market credit.
Overall, this chart highlights how flows into emerging market credit have been steadily positive since early 2025, having been negative in the preceding period.
1. Strong credit fundamentals
Although EM credits are often viewed as among the riskier areas within global fixed income markets, credit ratings suggest this is not necessarily the case. Three-fifths (62%) of EM corporate credit issued in hard currency is rated ‘investment grade’.3
Companies continue to exhibit robust fundamentals. Leverage levels are relatively low: in fact, EM corporate leverage multiples are, on average, lower than in developed markets.4 Liquidity profiles are also strong, especially in the context of limited refinancing requirements. There is no bond ‘maturity wall’ imminent looming across any EM region.
Providing corporate earnings can remain steady or growing, issuer defaults should remain near their historically low levels. The forecast default rate across the EM corporate universe for 2026 is only 1%, versus 1.8% for the US high yield market.5
This conservative risk profile is reflected in the fact that credit rating agencies continue to issue more upgrades than downgrades within the asset class.6
2. Tight spreads, but compelling yields
Credit spreads are often cited by investors for reluctance to increase their allocations to credit. Emerging markets are no exception. Spreads are around their tightest levels since May 2007, leaving little room for further compression.7
However, looking beyond the index level, there is some dispersion in credit spreads on offer, and distinguishing between regions or sectors can uncover relative value opportunities for active managers: for example, EM investment grade spreads in Asia trade at 76 basis points (bps) versus 160bps for Latin America.8
Tight spreads should also be viewed in the context of the market’s strong credit quality, outlined above. Additionally, yields remain relatively high in their historic context: EM investment grade yields (5.1%) are above their 15-year historical average (4.5%), while those of EM high yield sit only marginally below (7.5% versus 7.8%).9 Barring an unexpected severe risk-off event, which could push spreads materially wider, we expect that carry alone should fairly compensate investors.
Past performance is not indicative of future returns.
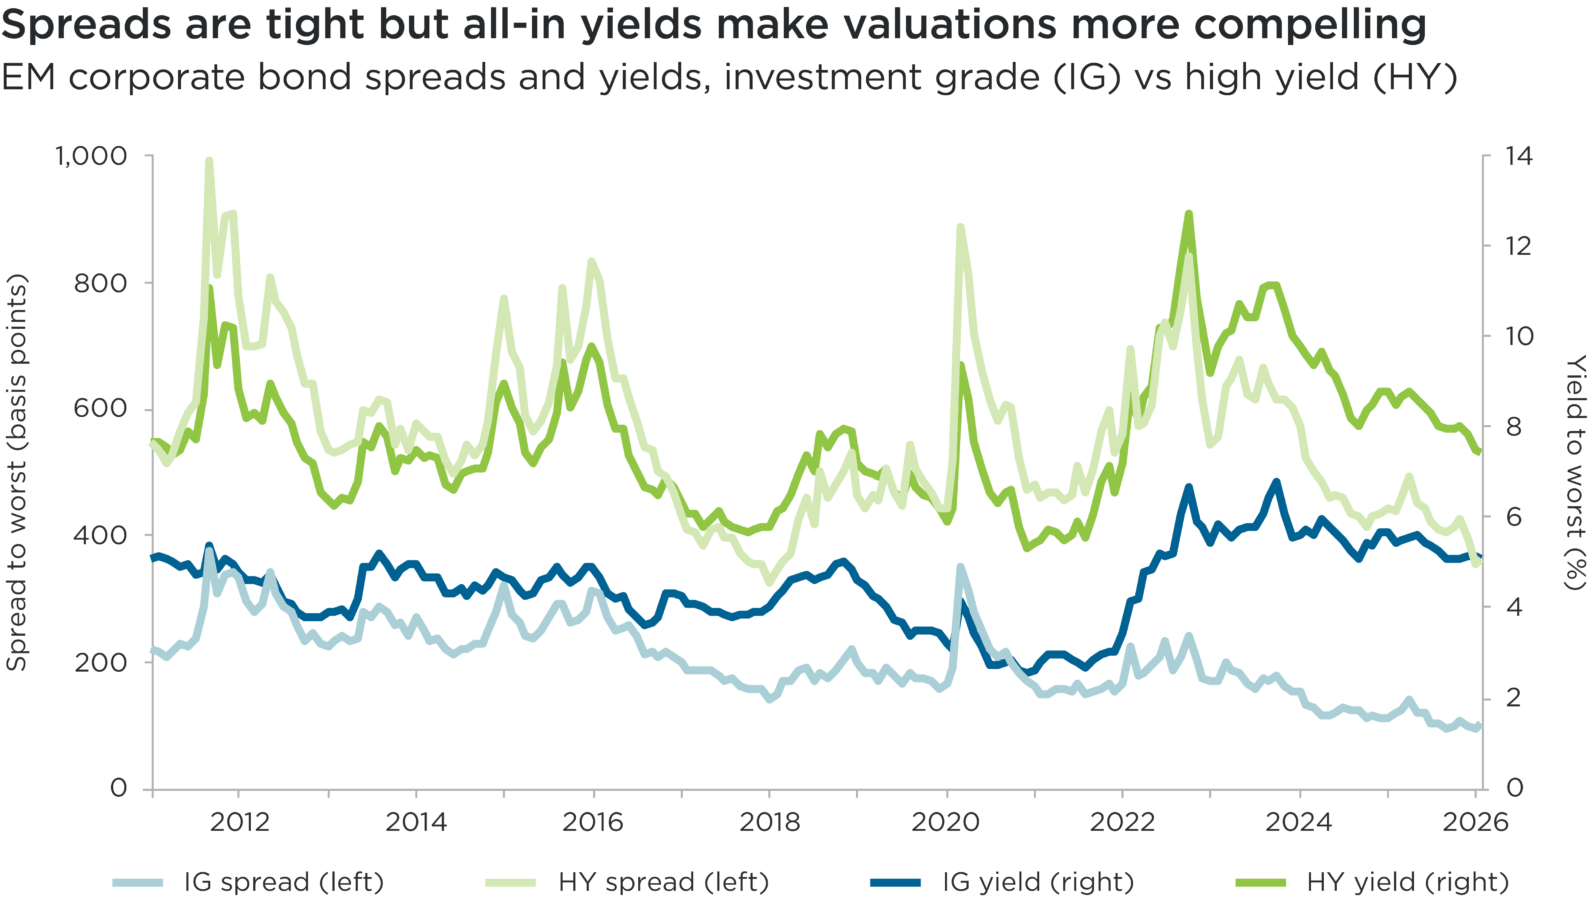
Source: Bloomberg data, 23 February 2026. Period 31 January 2011 to 20 February 2026.
Figures are based on the JPMorgan Corporate Emerging Market Bond Index (CEMBI) Broad Diversified.
Indices are unmanaged and not available for direct investment
Subhead: EM corporate bond spreads and yields, investment grade (IG) and high yield (HY)
Overview: This line chart compares the spreads and yields to worst of investment grade (IG) and high yield (HY) emerging market corporate bonds, from 31 January 2011 to 20 February 2026. Spreads (measured in basis points) reference the left-hand y-axis. Yields (%) reference the right-hand axis.
Overall, this chart illustrates how spreads and yields have diverged since 2022, for both investment grade (IG) and high yield (HY) emerging market corporate bonds. While both spreads have generally continued to decline, their yields sit at around levels seen at the start of the period.
There also continues to be an ‘EM premium’. Where EM corporates exhibit comparable fundamentals, leverage and business profiles to developed market issuers, they trade at materially higher yields. This spread differential is a function of structural factors including investor segmentation, mandate constraints, benchmark design and persistent, jurisdiction‑level macroeconomic factors.
Sovereign risk also influences pricing, mainly by limiting how fully corporate attributes are reflected in spreads. Credit valuations are connected to those of domestic government bonds, leaving many high‑quality EM corporates trading wider than their intrinsic credit strength may justify.
Together, these factors create a persistent valuation gap that supports enduring opportunities for active investors to target a carry comparable to that of the US high yield market from EM credits whose qualities are closer to investment grade.
3. Technical tailwinds
The sharp uptick in issuance seen in developed markets – resulting from increasing investment in AI-related infrastructure – is not as prominent a concern for emerging markets. In 2025, net financing (issuance minus amortisations, coupons and corporate actions) was higher than in previous years, but was still negative.
Net financing is expected to creep up modestly in 2026, but remain negative.10 There will be some regional dispersion – with more issuance in the Middle East, for example – meaning managers should be selective.
Negative net supply is supportive for bondholders, overall, with strong demand for the asset class expected to continue from an increasingly global investor base. Asian and Latin American bonds are predominantly held by domestic investors and thus are less prone to flows driven by developed market central banks and macroeconomic events. Their long-term ownership models support resilience in the market.
4. Diversification potential
Over the past two decades, the stock of EM hard currency corporate bonds has grown from less than US$300bn to more than US$2.5tn.11 The composition within this expanded market is well-diversified, with issuers from more than 60 countries and sector composition that is differentiated from the concentrated ‘AI trade’ seen recently in global equities.
The high diversification potential of EM hard currency corporate debt is reflected in historic performance. Over the past decade, the annualised Sharpe ratio of EM corporate bonds has been 0.3, compared with 0.1 for hard currency EM sovereign bonds and –0.2 for local currency EM sovereigns (hedged to US dollars).12 A higher Sharpe ratio indicates superior risk-adjusted returns.
Further, Impax‘s own analysis has suggested that, historically, adding EM corporate bonds to a portfolio of emerging market sovereign bonds can reduce portfolio risk without impacting returns.13
5. A supportive macroeconomic backdrop
The macroeconomic context currently looks supportive for the asset class. Inflation seems to have peaked in key emerging markets and there are broad expectations that monetary policy will be supportive as central banks cut interest rates from high levels that continue to support inflows into EM assets.
US trade tariffs meanwhile have not had the impact that some investors (ourselves included) feared following ‘Liberation Day’ last April and, at the new universal rate of 10% (potentially rising to 15%), seem manageable for EM exporters.
The possibility of higher tariffs remains, though. The asset class is also vulnerable to a potential ‘higher for longer’ scenario for US Treasury yields. If inflation returns to the US, or investor concerns about the US fiscal deficit resurface, companies may eventually suffer margin pressures as they face higher costs of refinancing.
The importance of selectivity
The risks inherent within EM corporate debt create high dispersion. We believe this ultimately generates opportunities for active investors to outperform by combining bottom-up relative value screening with rigorous fundamental research and a top-down appreciation of regional and sector dynamics.
As we look at opportunities within EM corporate bonds in 2026, we perceive pockets of value among issuers in certain economies that have particularly out of favour recently. In Turkey, for example, the sovereign credit rating is trending upward and inflation is coming under control, with high real rates helping domestic companies heavily reliant on imports. Latin American economies – and Brazil, especially – should meanwhile benefit from the Mercosur-EU free trade agreement signed in January.
Some things never go out of fashion; selectivity within EM credit investing is one.
Past performance is not indicative of future returns.
1 JP Morgan, February 2026
2 JP Morgan CEMBI Diversified USD Hedged (total returns)
3 JP Morgan, December 2025: Emerging Markets Corporate Strategy 2026 Outlook
4 BofAML Chartbook, 31 December 2025, based on net debt-to-EBITDA ratios
5 JP Morgan, December 2025. Note that the forecast default rate for emerging market high yield corporate bonds in 2026 is 3%
6 JP Morgan, December 2025: Emerging Markets Corporate Strategy 2026 Outlook
7 JP Morgan CEMBI, as at 20 February 2026
8 Bloomberg data, JPM CEMBI Broad Diversified sub-indices, as at 31 December 2025
9 JP Morgan CEMBI, as at 20 February 2026
10 JPMorgan, as at 31 October 2025
11 JPMorgan, as at 31 October 2025
12 JPMorgan, as at 31 October 2025
13 Impax analysis, February 2026, based on efficient frontier / Sharpe ratio calculation of monthly returns of two ICE indices – Emerging Markets Corporate Plus and Emerging Markets External Sovereign – over the period 2006 to 2026
Nothing presented herein is intended to constitute investment advice and no investment decision should be made solely based on this information. Nothing presented should be construed as a recommendation to purchase or sell a particular type of security or follow any investment technique or strategy. Information presented herein reflects Impax Asset Management’s views at a particular time. Such views are subject to change at any point, and Impax Asset Management shall not be obligated to provide any notice. Forward-looking statements or forecasts herein are subject to known and unknown risks and uncertainties including inaccurate assumptions that could cause actual results to differ materially from those expected or implied by the forward-looking statements. . While Impax Asset Management has made reasonable efforts to obtain information from reliable sources, we make no representations or warranties as to the accuracy, reliability or completeness of third-party information presented herein. No guarantee of investment performance is being provided and no inference to the contrary should be made.