
 United States
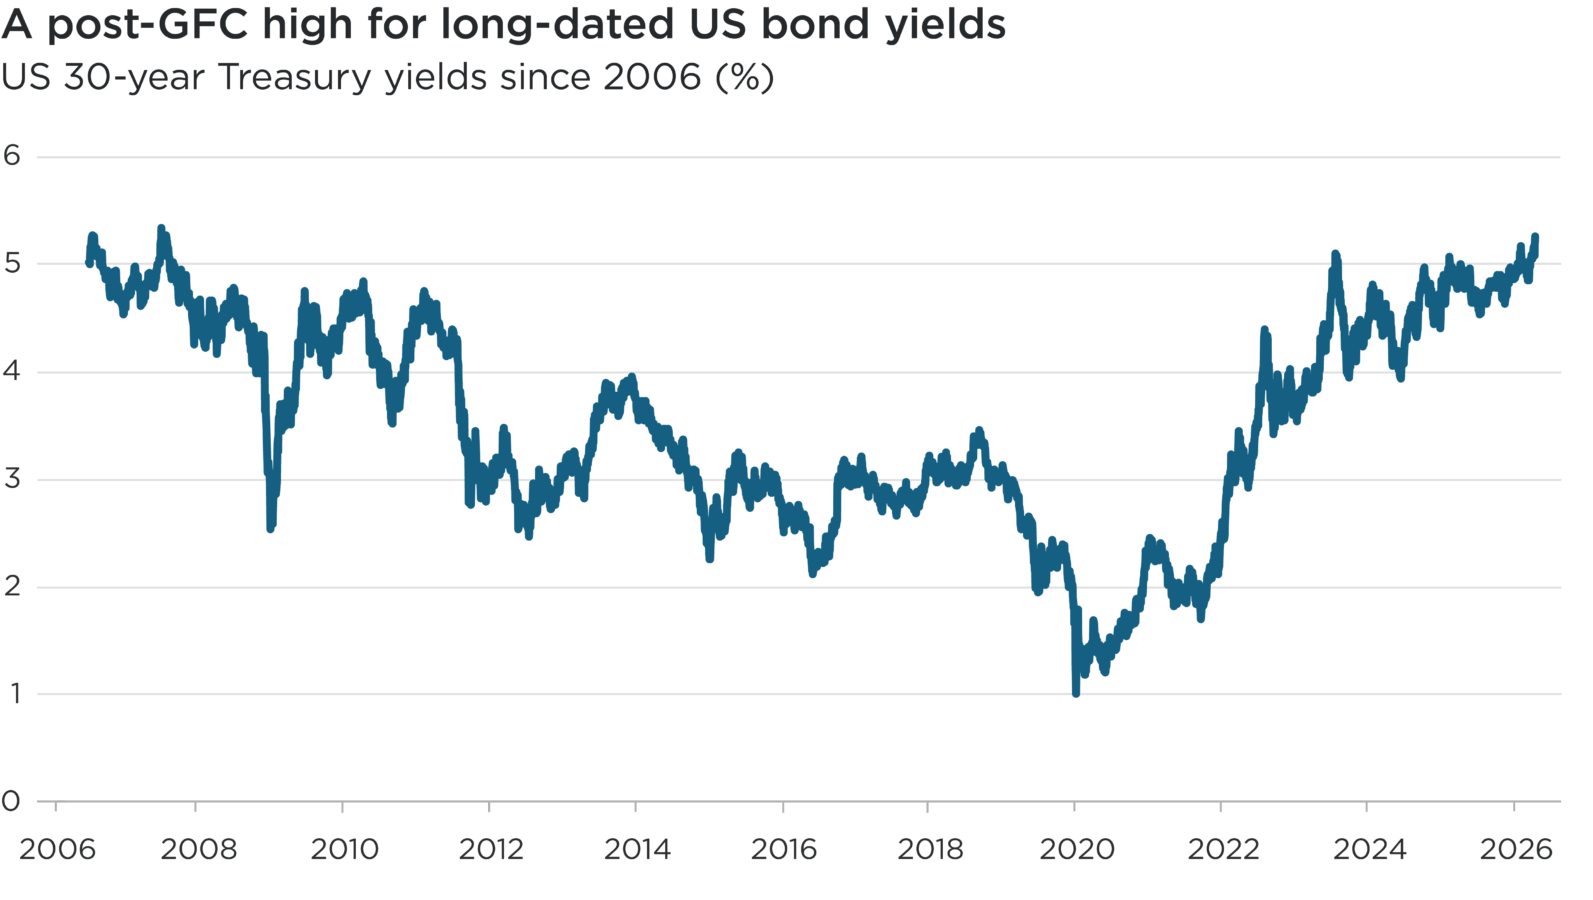
US 30-year Treasury yields touched 5.28% at the end of July – their highest level in almost two decades.1
Rising Treasury yields can often reflect market expectations of economic expansion. The recent sell-off of long-dated US government debt is not a growth signal, though. It is instead a signal that the credibility of US monetary policy is in question.
Despite inflation running at nearly double the 2% target, the Federal Reserve (Fed) left interest rates unchanged for the fifth consecutive time at its late July meeting – and for the second time since Kevin Warsh assumed the role of Fed Chair this year.2
It is not the Fed’s decision to hold the target rate at 3.50% to 3.75% that spooked markets, however. It is arguably instead Warsh’s deliberate opacity regarding the decision-making and aversion to sharing forward guidance on monetary policy.
The pressure on long-dated US Treasuries matters for credit investors, for whom duration risk is rising at a time when compensation for risk, in the form of spreads, is relatively thin.
Past performance is not indicative of future returns and outcomes may vary.
Source: Bloomberg data, 4 August 2006 to 6 August 2026.
Parallels with the ’70s
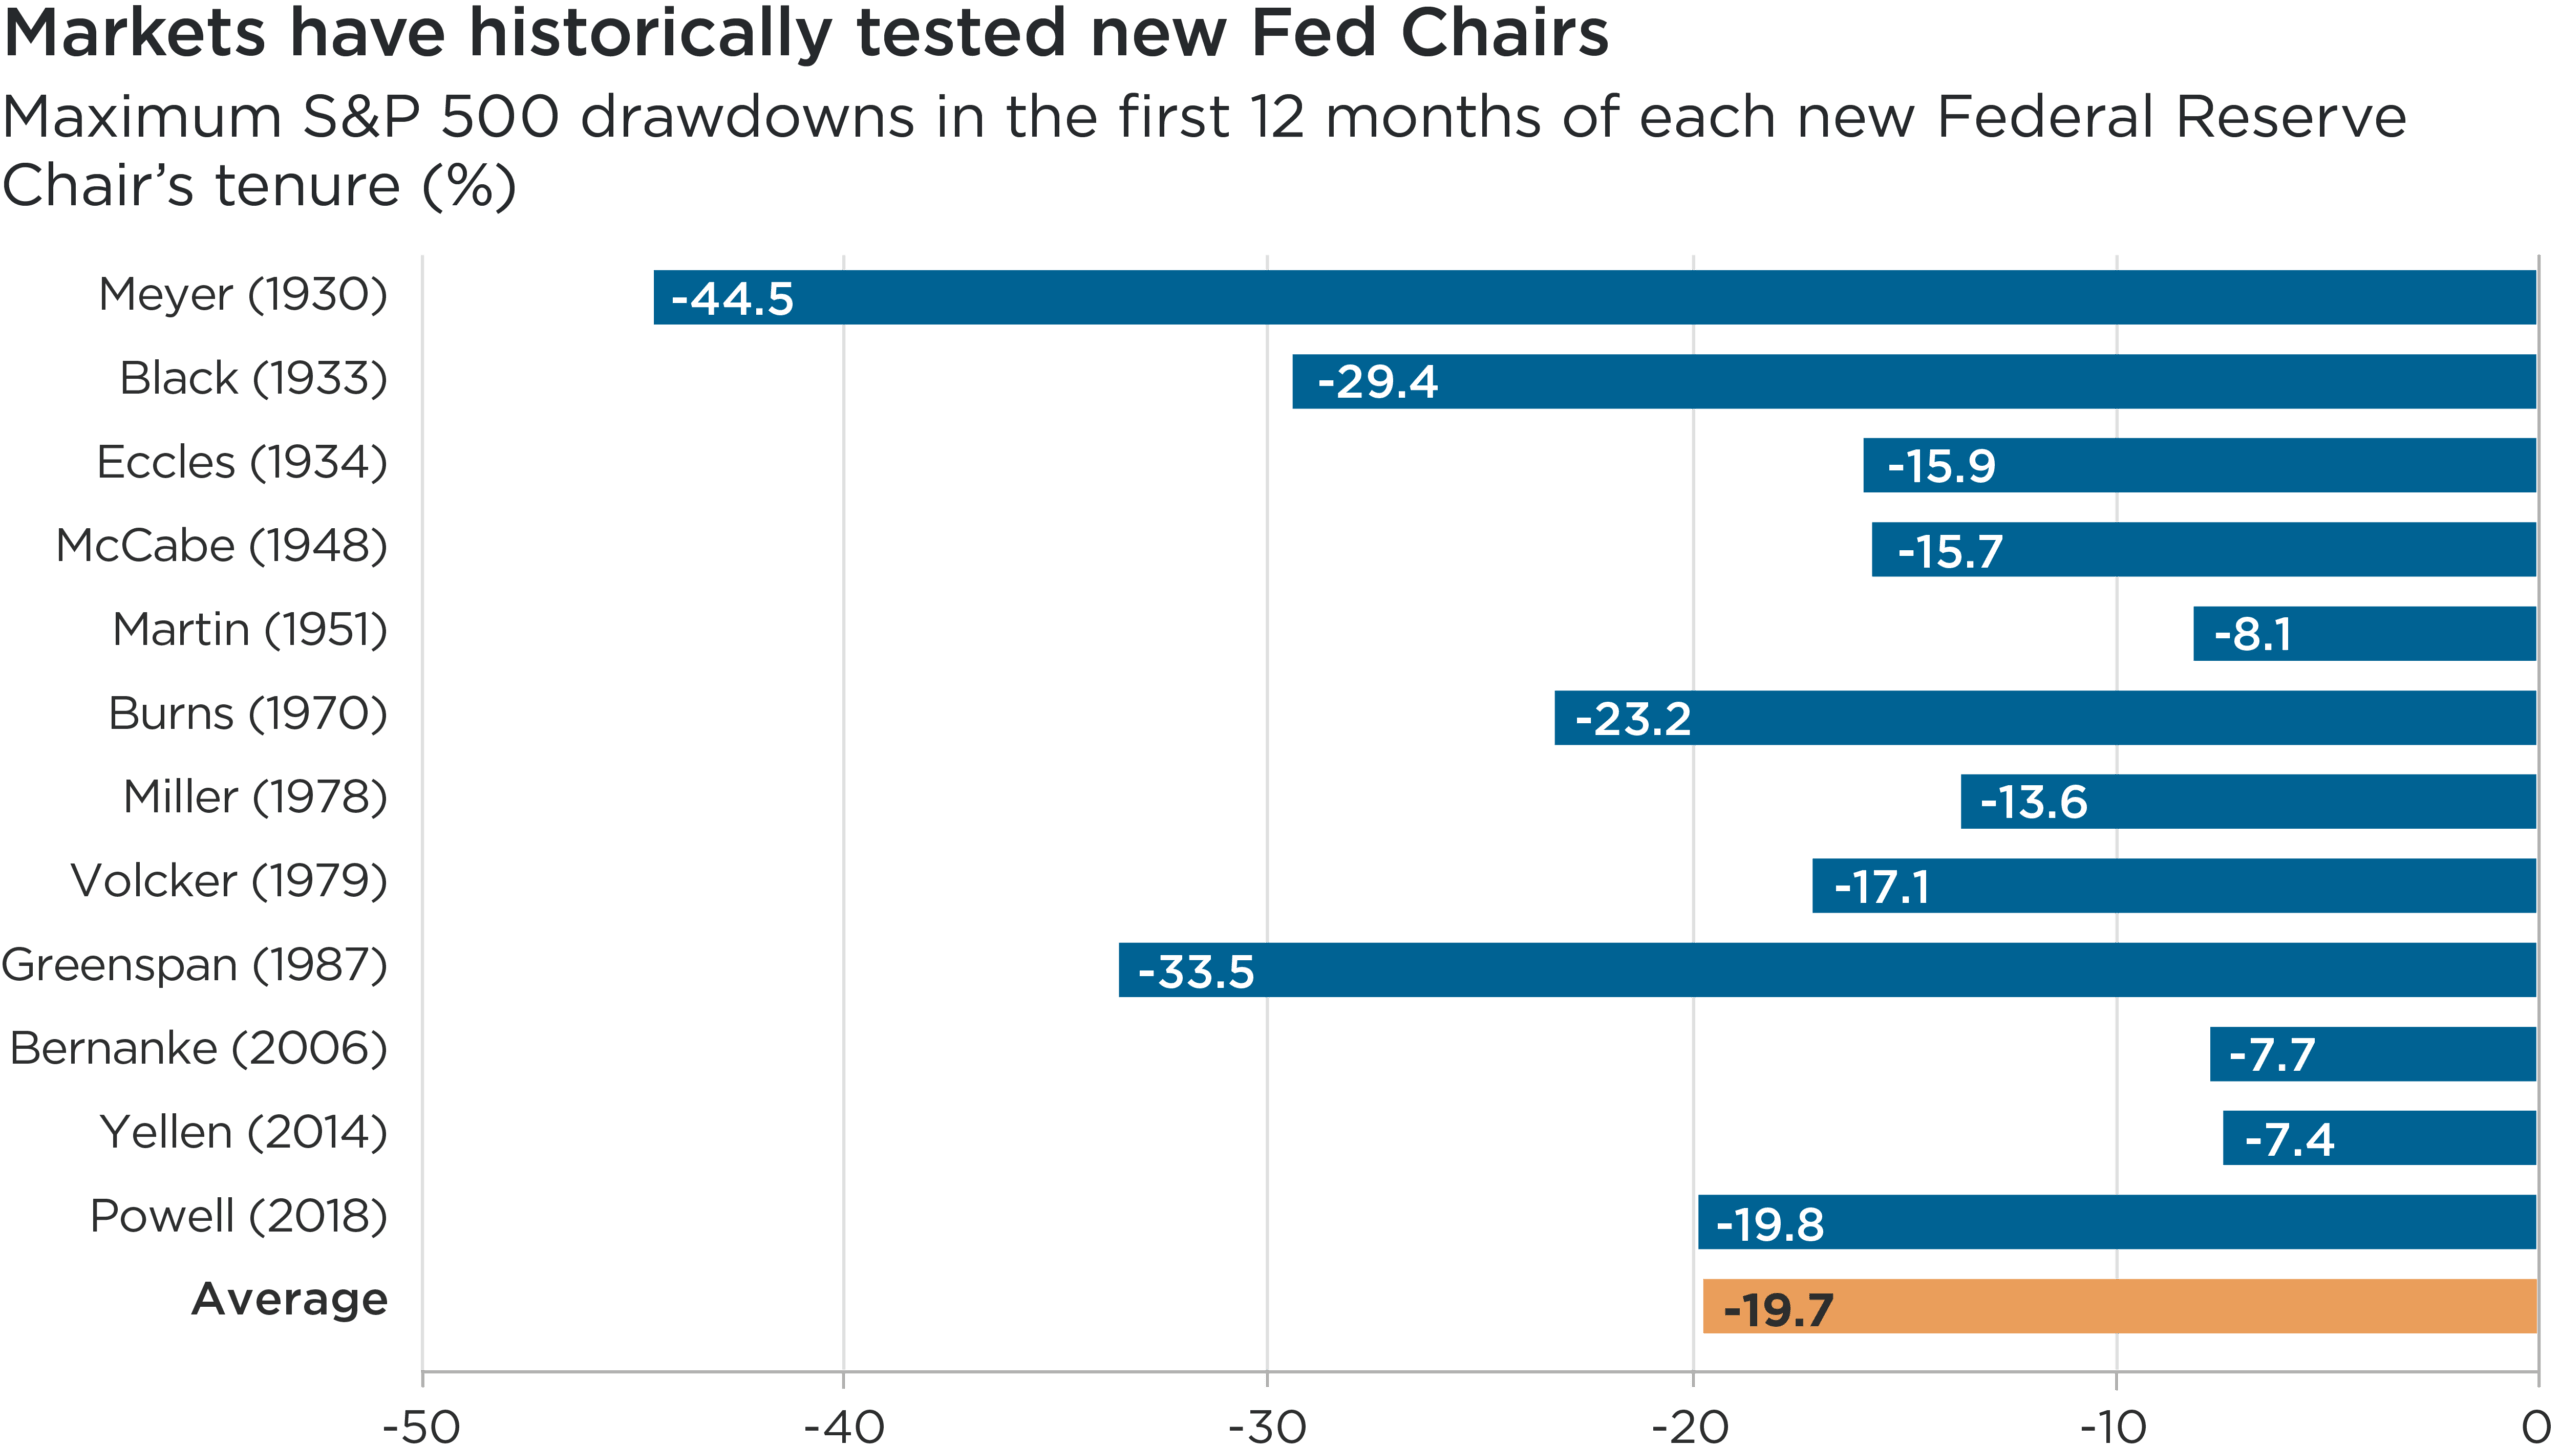
Markets are prone to testing the resolve of new Fed Chairs: Volcker in 1979; Greenspan through the crash of 1987; and Powell in late 2018. By demanding higher risk premiums on US Treasuries amid elevated inflation (and an ominous fiscal outlook, of course), bond investors are now challenging the Fed’s tolerance of market volatility.
Analysis of US stockmarket performance also reflects this historic tendency to test new Fed Chairs. Looking back as far as 1930, in nine out of 12 instances, the S&P 500 index experienced a drawdown greater than 10% within the first 12 months of a change of Fed leadership (see chart below).3
We think the most obvious parallel with today lies with 1970, when the much-maligned Arthur Burns assumed responsibility for US monetary policy.
Burns did not set out to preside over the ‘Great Inflation’. He argued, with considerable intellectual rigour, that the inflation of the early 1970s was driven by supply-side phenomena – namely oil and food prices and wage-setting institutions – and that monetary policy was the wrong instrument to combat them. Under his leadership, the Fed therefore looked through and avoided raising interest rates as much as it might have done.
We hear four echoes of this era now.
First, the supply-shock alibi. Brent crude oil prices remain elevated – around one-third higher than at the start of 2026 – on the back of the Iran war. Tariffs are also feeding through into prices. While exogenous, the impacts of each are genuinely inflationary.
Second, endurance. The Fed has now missed its 2% inflation target for more than five years. At what point does it stop being a sequence of shocks and start being recognised as a regime of elevated inflation?
Third, political proximity. The Wall Street Journal has reported on frequent informal contact between President Trump and Chair Warsh in the past few months.4 Separately, the latter has floated a renegotiated Treasury–Fed Accord that would shift some balance sheet authority towards the Treasury Secretary. Although Warsh has been emphatic that Fed independence is sacrosanct, and there is no evidence to the contrary, perceptions matter – and the market is now charging a premium for perceived risks to Fed independence.
Fourth, the communication vacuum. Warsh has stripped out forward guidance and floated the idea of fewer Federal Open Market Committee (FOMC) meetings at which interest rates are reviewed. The intellectual case is respectable since guidance traps central banks in their own words. The proposal’s timing is unfortunate, however. Removing the anchor while inflation is unresolved leaves the market to price the reaction function itself – and it has repriced it through the long end of the Treasury curve.
Past performance is not indicative of future returns and outcomes may vary.
Source: Impax analysis of S&P 500 daily price index data (Bloomberg), August 2026. Barclays BETS methodology. Maximum peak-to-trough drawdown in the 12 months following each Chair’s start date. The S&P 500 Index was launched in March 1957. Prior to this, precursor indices published by Standard & Poor’s are used for analysis.
Implications for credit investors
In this context, the long end of the US government debt market – which informs the price of risk assets worldwide – is clearly under some strain.
This was effectively recognised by the US Treasury’s joint intervention, alongside its Japanese counterpart, to support the value of the yen in late July (a first since 1998). Tellingly, it funded the purchase of yen using euros, thereby avoiding the sale of US Treasuries.5 When a government starts actively managing the bid for its own debt, it is an implicit acknowledgement of market pressure.
For credit investors, the immediate risk arising from a steepening Treasury yield curve is duration, not spreads.
Higher long-term bond yields pose a risk to bond prices by effectively reducing the value of future cashflows. With credit spreads still historically tight, investors are receiving limited compensation for taking extra duration risk given the possibility of higher interest rates. Should long-term yields rise to around 6% or beyond, the typical diversification across asset classes could fade, putting pressure on almost all risk assets.
This ominous picture notwithstanding, the direction of travel is not set in stone. Five-year, five-year inflation swaps – what the market is effectively expecting US inflation to average between 2031 and 2036 – currently sit near 2.4%.6 Most investors therefore expect the Fed to successfully bring it down towards its long-term target, despite inflationary pressures.
The direction of travel for US Treasury yields will be set in the run-up to US mid-term elections in November. All eyes and ears will be fixed on the next FOMC meeting in mid-September, when any surprise on interest rates could have significant market and political repercussions.
1 Bloomberg, 6 August 2026
2 Federal Reserve, 29 July 2026
3 The S&P 500 Index was launched in March 1957. Prior to this, precursor indices published by Standard & Poor’s are used for analysis
4 Schwartz, B., Wegmann, P. & Timiraos, N., 5 August 2026: Trump Has Called Warsh Repeatedly Since He Became Fed Chair. Wall Street Journal
5 Eichengreen, B., 5 August 2026: The real message in the yen intervention. Financial Times
6 Bloomberg, 6 August 2026
References to specific securities are for illustrative purposes only and should not be considered as a recommendation to buy or sell. Nothing presented herein is intended to constitute investment advice and no investment decision should be made solely based on this information. Nothing presented should be construed as a recommendation to purchase or sell a particular type of security or follow any investment technique or strategy. Information presented herein reflects Impax Asset Management’s views at a particular time. Such views are subject to change at any point and Impax Asset Management shall not be obligated to provide any notice. Any forward-looking statements or forecasts are based on assumptions and actual results are expected to vary. While Impax Asset Management has used reasonable efforts to obtain information from reliable sources, we make no representations or warranties as to the accuracy, reliability or completeness of third-party information presented herein. No guarantee of investment performance is being provided and no inference to the contrary should be made.