
 United States
In each of the last three years, the US has experienced at least 20 extreme weather-related disasters that each caused at least US$1bn in financial losses. The Los Angeles wildfires in January 2025 alone led to US$61bn in estimated damages.1
The rising costs of weather events made more intense and frequent by climate change are borne across the economy, but how do they transmit to credit risk?
Our analysis of severe weather events’ impact on parts of the US corporate bond market since 2005 identifies narrow, but deep negative impacts in one specific part of the market: the bonds of utilities implicated in wildfires in California, but crucially not other states, sold off almost immediately. Hurricanes, by contrast, have left utility, insurance and bank spreads largely untouched.
For credit investors, one conclusion has to be that only issuance selection, not sector avoidance, can manage this risk. Furthermore, credit ratings offer no substitute for analysis when downgrades lag bond repricing. Investors need to therefore better understand where physical climate risks specifically lie in order to navigate the tail risks associated with certain extreme weather events.
Our analysis
To evaluate the impact of climate-driven extreme weather on credit markets, we mapped the monthly performance of US corporate bonds to 40 severe weather events over the past two decades. The US was chosen due to data availability. We identified the constituents of both the ICE BofA US Corporate and US High Yield indices that have geographic exposure to each event and then measured their spreads against a benchmark that excluded them.2
Four sectors that, in principle, have among the highest exposure to the underlying risks were in scope for our analysis: utilities, primary insurers, reinsurers and regional banks.3
In our adaptation of an event-attribution approach recently applied to equity funds, we made two changes.4 First, we used excess return over duration-matched governments, rather than total returns, because utility credit is a long-duration sector and a single move in rates would otherwise dominate any hazard effect. Second, we measured positioning in duration-times-spread, rather than market-value weight. Each result was tested against 2,000 random, non-event periods as a control.
There were five key findings.
1. Wildfires have moved specific utility credits…
Our first finding is that bonds issued by utilities operating in areas that suffered wildfires materially underperformed in their immediate aftermath.
Against the broad corporate market, affected utilities underperformed by an average of 76 basis points (bps) over the two months following a wildfire in their territory.
Importantly though, there was no general widening of sector spreads during these periods. In other words, there was no sector contagion: the repricing lands on the specific issuer whose equipment is implicated (see Table 1 below). The tail risk is severe. At the extreme, bonds issued by Pacific Gas & Electric (PG&E) underperformed by 947bps against its sector benchmark in November 2018, the month of the catastrophic Camp Fire in northern California. The wildfire, which killed 85 people and led to insured losses of US$8bn, was started by what transpired to be a poorly maintained PG&E transmission line.5
Past performance is not indicative of future returns and outcomes may vary.
Table 1: Relative performance of US utility credits affected and unaffected by wildfires
| Group | Number | Mean relative performance | Median relative performance | Share negative |
|---|---|---|---|---|
| Wildfire-affected utilities | 47 | -76.4bps | -36.3bps | 68% |
| Unaffected utilities | 239 | +9.2bps | -0.3bps | 50% |
Impax analysis, August 2026. Basis points of excess return over duration-matched governments, measured against the broad corporate index and adjusted for spread-duration-times-spread beta. Two-calendar-month event window; 10 wildfire event-months, 2017 to 2025.
Sources: Bond-level data: ICE BofA US Corporate Index (C0A0) and ICE BofA US High Yield Index (H0A0) constituent files, ICE Data Indices, LLC. 2,187,103 bond-month observations across 246 month-end dates, January 2006 to June 2026. Fields used: option-adjusted spread, spread duration, effective duration, market value, index weight, composite rating, ICE industry classification levels 2–4, and excess return versus duration-matched governments.
Event universe: US Billion-Dollar Weather and Climate Disasters, originated by NOAA’s National Centers for Environmental Information. The product was retired after calendar year 2024 and has been stewarded by Climate Central since July 2025 under the same methodology and lead scientist. The series records 431 US events since 1980 as of March 2026. Forty events falling within the sample period are used here.
2. … but only in certain states
Our second, related finding is that jurisdiction is all-important when it comes to how wildfires move utility bond prices.
The contrast between California and Oregon demonstrates this point most clearly. The latter, like most US states, holds a utility liable only where it is shown to have been at fault and failed to take reasonable care. Establishing liability through the courts can take years, though.
For example, utility PacifiCorp’s equipment was implicated in the state’s Labor Day 2020 fires, which cost 11 lives and led to losses of nearly US$1.9bn, but its bonds were not affected in subsequent months.6 In fact, a repricing only came almost three years later once a jury found PacificCorp to have acted negligently (and to be liable for the wildfire).7 Until this ruling, it remained an open question whether the company would be found responsible at all.
California, on the other hand, has a strict liability regime. The principle of inverse condemnation means the state’s courts will hold a utility responsible for property damage wherever its equipment causes a fire. This means that bond markets will look to price the potential impacts on an issuer as soon as causation becomes apparent, as illustrated by the case of PG&E in 2018.
3. Credit rating downgrades often lag
Our analysis finds that credit ratings agencies tend to lag credit markets in reevaluating affected utilities following a wildfire event.
While Moody’s downgraded PG&E by one notch in the week following the Camp Fire, its spreads had doubled to 356bps by the time S&P took the decisive step of cutting PG&E by five notches, to single- ‘B’, in January 2019.8
It took longer still for Edison to be downgraded following the Eaton Fire in Los Angeles in January 2025. While spreads widened by around 150bps that month, S&P reaffirmed its rating with a negative outlook in February and only cut its rating that September.9 The composite rating on Southern California Edison first mortgage bonds – which represent most of the utility’s index-eligible debt – had not moved at all by June 2026.
4. Hurricanes have not moved utility credits
Our analysis failed to identify a correlation between other major natural catastrophes and bond price movements in the sectors of the US credit market that we analysed, including utilities (see chart below and Table 2).
Even major hurricanes, which have destroyed billions of dollars of infrastructure and account for roughly 80% of all lost power hours for US electricity customers, have left Gulf coast and Florida utility spreads essentially untouched over the past two decades.10
This is because utilities are not deemed responsible for third-party damages caused by hurricanes (unlike wildfires). Instead, cost recovery frameworks effectively pass the costs on to utility customers and insurers (who pass them on to policyholders), not bondholders.
Past performance is not indicative of future returns and outcomes may vary.
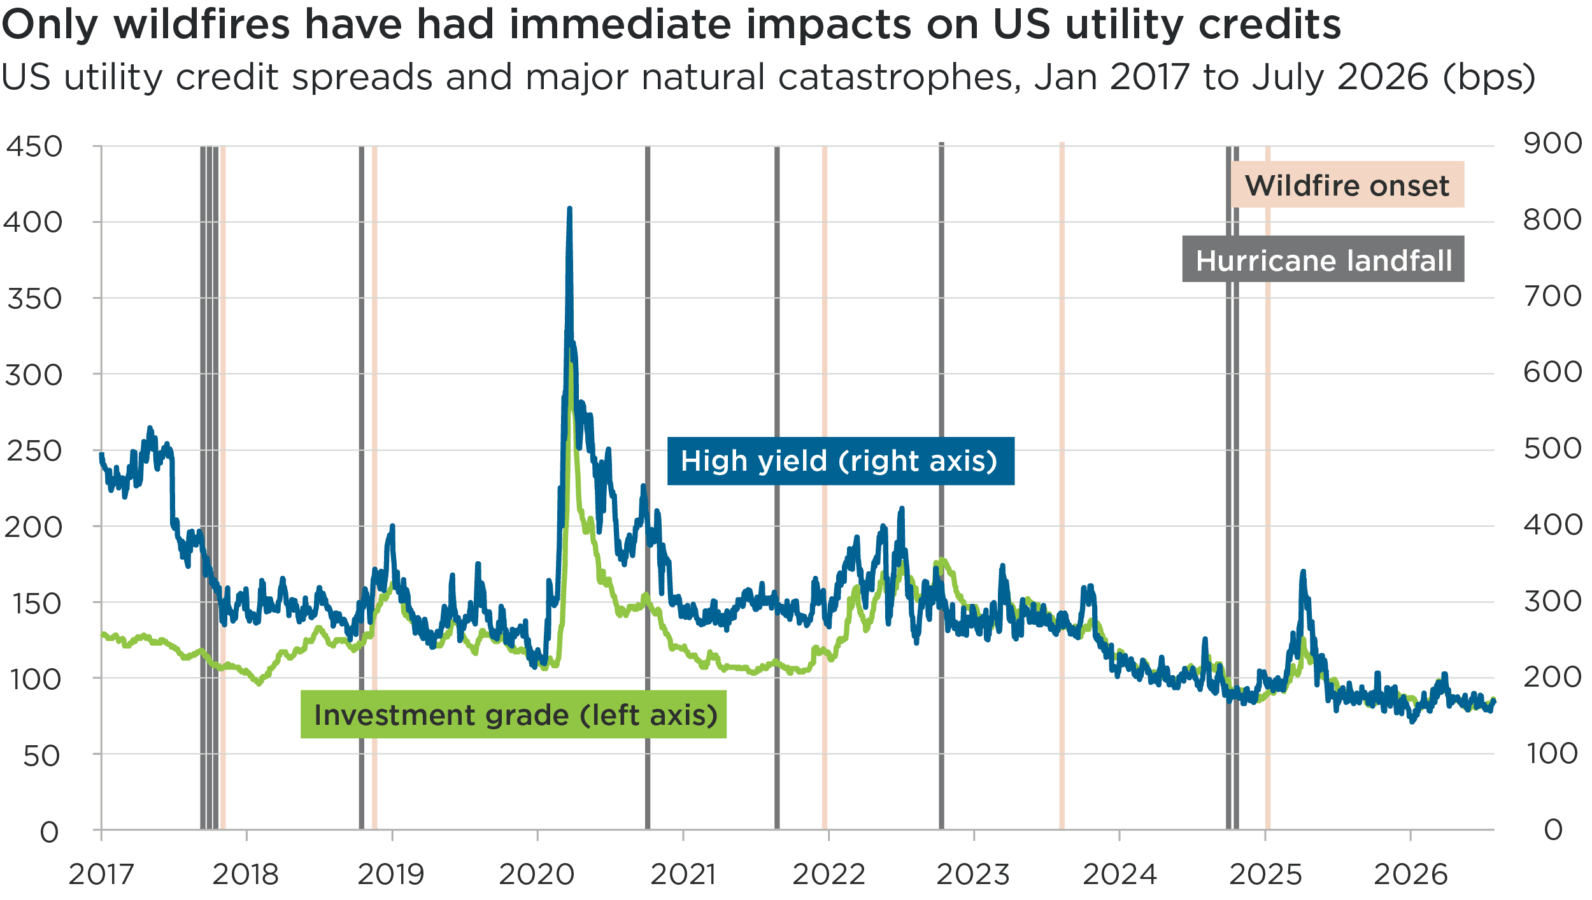
Sources: ICE BofA US Corporate Index (C0A0) and ICE BofA US High Yield Index (H0A0) / NOAA National Centers for Environmental Information. Data from 1 January 2017 to 31 July 2026.
Please note that that this chart serves as index-level context, rather than being a study output. Option-adjusted spreads for the investment-grade (C0Q0) and high-yield (H0EL) US utility indices, ICE BofA. Bands mark the onset of a subset of major events selected by insured loss – hurricanes with US landfall and industry insured losses exceeding US$10bn, and wildfires with insured losses exceeding US$2bn – not the study’s full 40-event universe.
5. Financial credits have not been affected
Finally, we also failed to identify a correlation between major natural catastrophes and other sector credits covered in our analysis.
As shown in Table 2 below, the price of bonds issued by primary property and casualty insurers, reinsurers and regional banks in the US were not consistently moved by extreme weather events.
This makes sense. After all, banks should not be affected so long as the households they lend mortgages to have adequate insurance coverage. In the case of insurers and reinsurers, credit risk over the medium-to-long term should hinge on their ability – given regulation freedom and modelling capabilities – to reprice risks as they evolve, not the severity of individual events.
Past performance is not indicative of future returns and outcomes may vary.
Table 2: Relative performance of US credit sectors by extreme weather events
| Group | Number | Mean relative performance | Median relative performance | Share negative |
|---|---|---|---|---|
| Utilities (wildfires) | 43 | -73.1bps | −42.3bps | 72% |
| Utilities (all hazards) | 170 | −17.4bps | −6.2bps | 54% |
| Utilities (hurricanes) | 82 | −1.1bps | +2.8bps | 49% |
| Primary insurers (all) | 120 | −5.7bps | −2.7bps | 53% |
| Reinsurers (all) | 181 | +36.4bps | +24.6bps | 38% |
| Regional banks (all) | 101 | +2.7bps | +3.5bps | 48% |
Impax analysis, August 2026. Sources as per Table 1 above, plus event attribution and dating cross-checked against California Public Utilities Commission wildfire investigation records, state fire agency incident reports and contemporaneous market reporting.
Basis points of excess return over duration-matched governments. Utility sets are measured against a utility sector benchmark rebuilt to exclude that event’s affected issuers; insurance and banking sets are measured against the broad corporate index, because a large catastrophe affects most national writers simultaneously. Control p-values are randomised p-values from 2,000 replicates in which the entire event-month is relocated, preserving the correlation between issuers sharing a hazard. Observation counts are issuer-months; because whole event-months are relocated, the effective sample for inference is the number of event-months in each set rather than the observation count. The affected-utility sample here differs from Table 1’s by four observations; the two measurements nonetheless agree to within 3.3 basis points on the mean.
Lessons for credit risk management
Our research highlights how specific physical climate risks are material, short-term credit events for individual borrowers within certain industries in the US, but not necessarily others. While conclusions may differ from other studies, it reinforces the finding that credit spreads move most sharply where issuers have concentrated asset-level exposure to extreme weather events.11
Within the US utilities sector, credit selection is clearly imperative to manage issuer-specific risks. Investors in issuers operating in fire-prone states that have strict liability regimes, most notably California, face tail-risks that could even lead to default. These liabilities look to only be deepening with recent state legislation.12
We assess physical climate risk issuer by issuer using our proprietary sustainability and credit risk PRISM framework, and look to identify and avoid certain issuers that are exposed to severe physical climate risks.13
Unsecured bonds issued by Californian utilities that are, in effect, exposed to uncapped risk are excluded from our universe, for example. Where we hold California utility risk, it has been through rate-recovery securitisations: non-recourse bonds secured by a dedicated charge authorised by the California Public Utilities Commission to fund catastrophic wildfire costs and grid hardening. Agencies take a similar view: Fitch, for instance, treats wildfire funds and assured, timely cost recovery through securitisation in rates as credit-supportive.14
The research’s other conclusions – where extreme weather events do not appear to move US utility, insurance or bank credits – are equally instructive.
Risks remain, but lay elsewhere. For instance, where primary insurers have refused to renew cover in high-risk areas, wildfire exposure has been passed onto state-backed pools and, in some cases, the catastrophe bond market.15
This highlights how many physical climate risks are systemic in nature, as well as being specific to certain geographies. The rising costs of extreme weather events made more frequent and intense by climate change were be borne across the global economy in the form of lower economic growth.16
The costs will not be borne equally, though. As credit investors, it is our conviction that analysis like this can help us better understand where the risks are concentrated today and, ultimately, enhance potential risk-adjusted returns.
- Climate Central, January 2026 ↩︎
- Custom sector benchmarks are constructed from index constituents using ICE industry classification (electric utilities; property and casualty and multi-line insurance; reinsurance; banking), with the full parent index used as the broad comparator. Positioning is measured as spread duration times option-adjusted spread, aggregated to ultimate parent using the index issuer key and adjusted for entity re-keying over time. In total, our analysis captured 2.2mn bond-month observations from January 2006 to June 2026 ↩︎
- We recognise that other sector credits can be materially affected by extreme weather events, as illustrated by other studies. For instance, MSCI, 2026: Physical Climate Risk and Corporate Bonds: Evidence from Hurricanes, found that the bonds of specific issuers within the asset-heavy Industrials sector had been negatively impacted by hurricanes. ↩︎
- The event-attribution approach adapted here was recently applied to equity fund portfolios in Donovan, C. W. and Collins, E., June 2026: Observing Climate Risks in Financial Markets: A Performance Attribution Approach. Tuck School of Business, Dartmouth College. The credit implementation differs in dependent variable, positioning metric, event window, exposure definition, benchmark construction and inference, and covers 40 events across four hazard classes. ↩︎
- Li, Z. & Yu, W., 2025: Economic Impact of the Los Angeles Wildfires. UCLA Anderson School of Management ↩︎
- Mindock, C., 23 January 2024: Berkshire’s PacifiCorp ordered to pay at least $62 million to homeowners for 2020 Oregon wildfire damage. Reuters ↩︎
- PacifiCorp litigation and ratings: James et al. v. PacifiCorp, Multnomah County Circuit Court; jury verdict of 12 June 2023 finding gross negligence and recklessness across four 2020 Oregon fires, with punitive damages set at 0.25 times economic and non-economic damages ↩︎
- PG&E Corporation Form 8-K, January 2019, reporting the S&P downgrade to ‘B’ on 7 January 2019 and the Moody’s downgrade to ‘B2’ on 10 January 2019, both below investment grade and under review for further downgrades; Moody’s downgrade of PG&E Corporation to Baa3, 15 November 2018 ↩︎
- S&P Global Ratings outlook revision on Edison International and Southern California Edison, February 2025 (ratings affirmed), and downgrade to ‘BBB-’, 17 September 2025; Fitch Ratings Watch Negative, 16 May 2025 ↩︎
- DiGangi, D., 2 December 2025: Americans lost more power last year than any year in previous decade: EIA. Utility Dive ↩︎
- For example, MSCI, 2026: Physical Climate Risk and Corporate Bonds: Evidence from Hurricanes and Acharya, V. et al., 2022: Is Physical Climate Risk Priced? Evidence from Regional Variation in Exposure to Heat Stress. National Bureau of Economic Research ↩︎
- Good, A. & Hering, G., 31 August 2026: California utility stocks slide on wildfire legislation. S&P Global ↩︎
- PRISM, Impax’s proprietary sustainability and credit risk framework, is applied across the fixed income investment universe. Issuers flagged as carrying severe physical climate risk are excluded from portfolios. ↩︎
- Fitch Ratings, March 2025: What Investors Want to Know: Assessing Wildfire Risk for U.S. Electric Utilities ↩︎
- Bloomberg, August 2026, citing Artemis data on catastrophe bond issuance with wildfire exposure exceeding US$5bn in the first half of 2026, approaching the full-year 2025 record; and on the non-renewal of more than one million California wildfire policies, with California FAIR Plan exposure in Los Angeles County growing by over 50% between 2024 and 2025. Testing the insurance channel properly requires insurance-linked securities pricing, which sits outside the corporate index data used here. ↩︎
- Rising, J. et al., April 2026: The macroeconomic case for investing in climate adaptation. Grantham Research Institute on Climate Change and the Environment ↩︎
References to specific securities are for illustrative purposes only and should not be considered as a recommendation to buy or sell. Nothing presented herein is intended to constitute investment advice and no investment decision should be made solely based on this information. Nothing presented should be construed as a recommendation to purchase or sell a particular type of security or follow any investment technique or strategy. Information presented herein reflects Impax Asset Management’s views at a particular time. Such views are subject to change at any point and Impax Asset Management shall not be obligated to provide any notice. Any forward-looking statements or forecasts are based on assumptions and actual results are expected to vary. While Impax Asset Management has used reasonable efforts to obtain information from reliable sources, we make no representations or warranties as to the accuracy, reliability or completeness of third-party information presented herein. No guarantee of investment performance is being provided and no inference to the contrary should be made.