 United States
American consumers face a landscape marked by elevated debt, rising unemployment fears and a high degree of economic uncertainty.
The prospect of US and reciprocal tariffs has ushered in a more negative macroeconomic outlook than markets had anticipated at the beginning of 2025. While US consumers enter this period of flux in a relatively healthy state, overall, rising dependence on short-term debt to meet basic needs is an early warning sign of financial stress. Should indebted households’ spending shift towards more essential items, the odds of a consumer-driven economic slowdown only get higher.
We are therefore taking a cautious view on credits that are more exposed to discretionary US consumer spending. In-depth understanding of balance sheet strength and the resilience of business models to economic downturn is critical in this context.
Source: Federal Reserve Bank of New York, February 2025: Center for Microeconomic Data: Household Debt and Credit Q42024
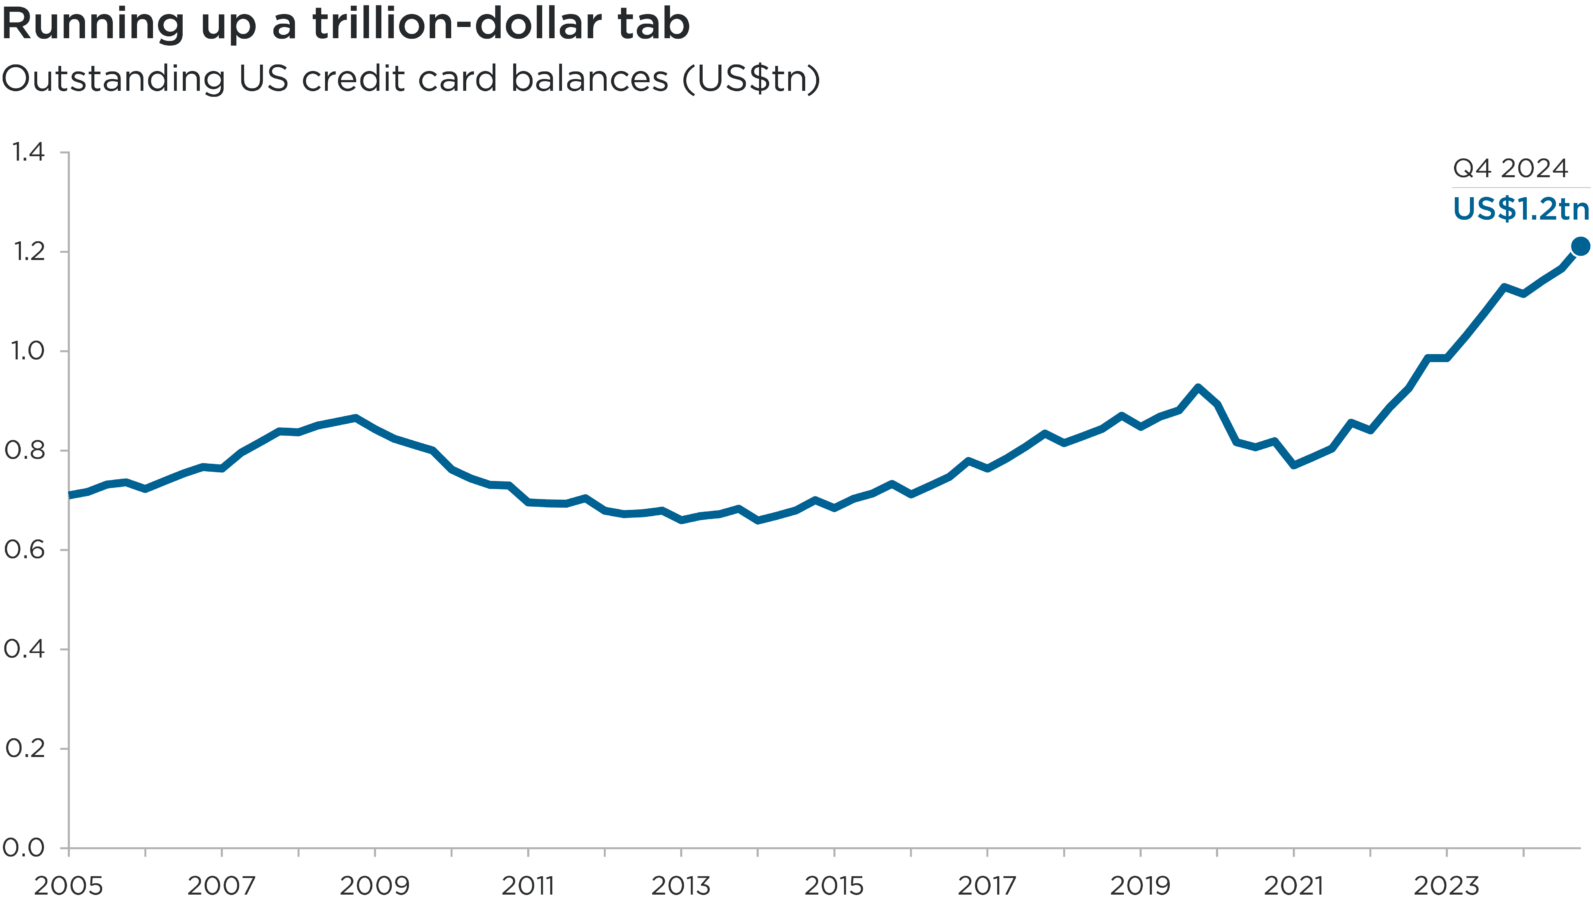
Subhead: Outstanding US credit card balances (US$tn)
Overview: This line chart shows the total outstanding balance of US credit card debts between the start of 2005 and the end of 2024.
Overall, this chart highlights the acceleration in outstanding credit card balances in the US since 2021.
Credit card debts are mounting
US credit card debt has reached a record $1.21tn, up 57% since early 2021.1 Some recent purchases might have been brought forward in anticipation of import tariffs, but data suggests that consumers have been turning to credit cards to bridge the gap between stagnant incomes and persistent inflation.
The burden is not evenly distributed. For lower-income households, the reliance on credit is especially acute and the risk of falling behind on payments is rising.
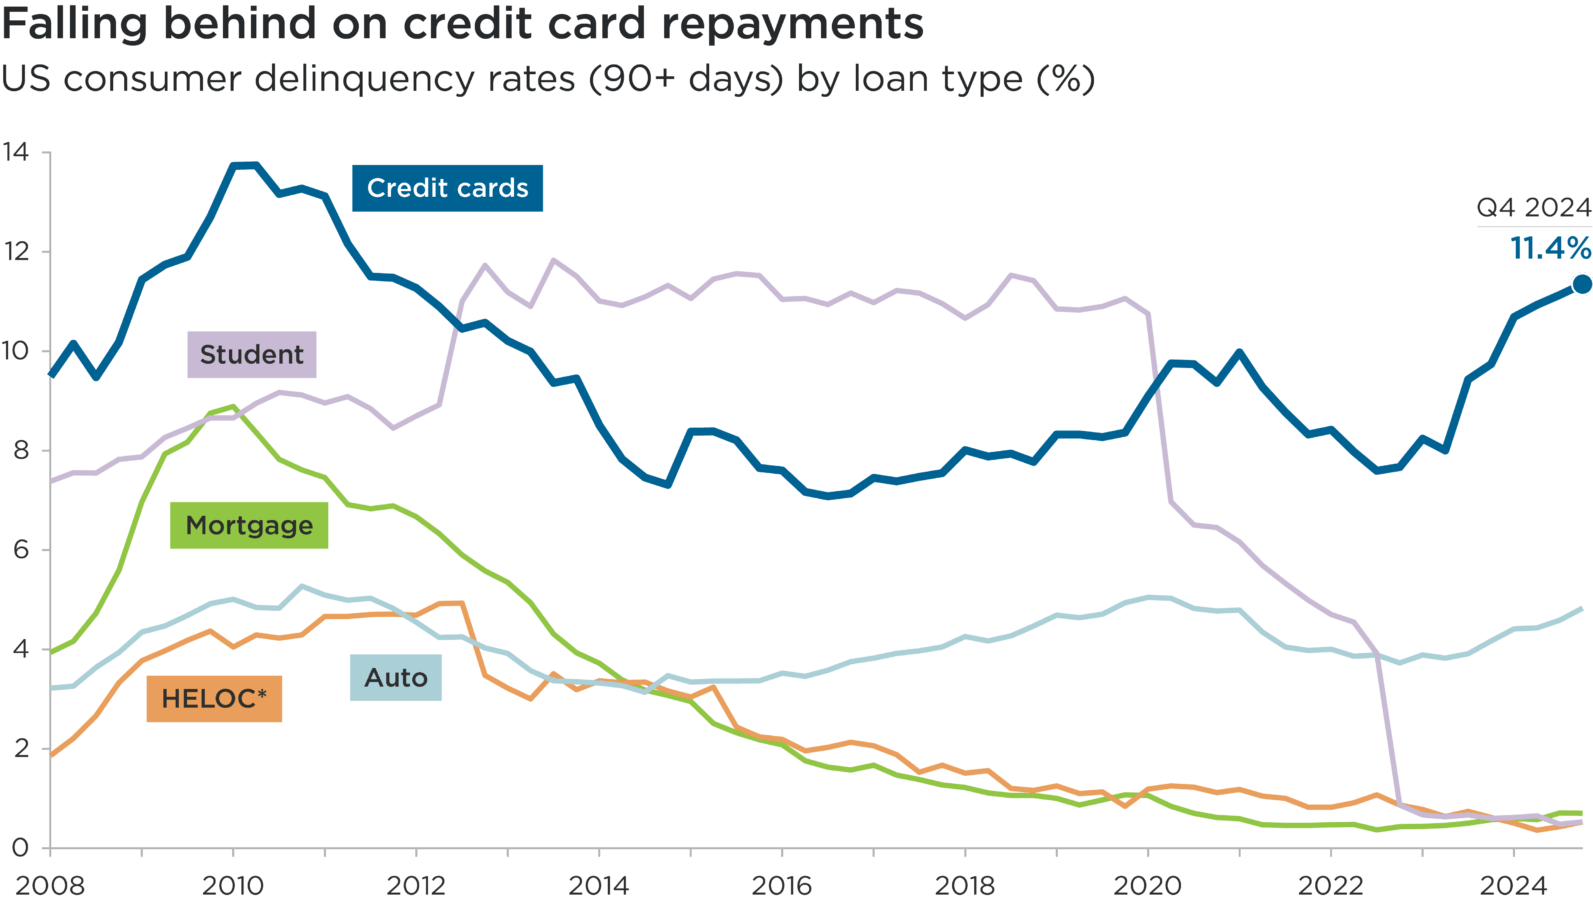
Delinquency rates on credit card bills – often the first debt to go unpaid in times of financial stress – are rising sharply. The share of card repayments overdue by 90 days or more breached 11% last year for the first time since 2012.2 Auto loan delinquencies have also been creeping up since the pandemic. Delinquency rates would be expected to climb further if unemployment rises.
In another sign of rising dependence on short-term borrowing to cover essentials, 25% of Americans now use buy-now-pay-later (BNPL) services to finance their groceries, up from 14% last year.3 While there is arguably a lack of understanding about how quickly BNPL loans can spiral, this is another indicator that more Americans are living beyond their means.
Source: Federal Reserve Bank of New York, February 2025: Center for Microeconomic Data: Household Debt and Credit Q42024
* Home Equity Line of Credit
Subhead: US consumer delinquency rates (90+ days) by loan type (%)
Overview: This line chart compares the percentage of major US consumer loans, by type, that have been delinquent by 90 days or more over the period 2008 to 2024.
Category one: Credit cards
Category two: Student
Category three: Mortgage
Category four: Auto
Category five: HELOC (Home Equity Line of Credit)
Overall, this chart shows that that while delinquency rates among most other major types of US consumer loan have remained low, or even fallen, over the past couple of years, delinquency rates among credit card loans have increased to their highest levels since the tail-end of the global financial crisis.
Unemployment and inflation concerns weigh on consumers
Recent data reveals a sharp uptick in anxiety about job security. According to the Federal Reserve Bank of New York’s March 2025 Survey of Consumer Expectations, the perceived probability that US unemployment will be higher in a year has surged to 44%, the highest since 2020.4 Expectations of losing work in the next 12 months have climbed 15%, with the increase most pronounced among households earning less than $50,000 annually.5
This comes despite modest job creation in March and a national unemployment rate that has only edged up to 4.2%.6 The disconnect between official statistics and consumer sentiment appears to be fueled by the high-profile drive to downsize the federal government’s workforce, which has resulted in tens of thousands of departures with more to come. This threatens to cascade into the private sector: for every federal worker laid off, research suggests at least 1.3 private sector jobs are lost.7
Another critical factor weighing on consumer health in 2025 is the resurgence of inflation fears. While the trajectory of tariff policies remains uncertain, their introduction will lead to higher consumer prices in the US. Analysis by Yale estimates average consumer losses of $2,100 per household.8
More expensive food, clothing and household items will further eat into discretionary incomes, especially for low and middle-income households that spend proportionally more on essentials.
Monetary policy will be all-important in determining the impacts of these challenges for struggling households – as well as for fixed income assets. As investors, we are therefore closely watching the policy response from the Federal Reserve.
Credit investing in consumer-facing sectors
Consumer cyclical issuers account for a material share (19%) of the US high yield market.9 For retailers and other companies whose fortunes are tied to US consumer health, a deep understanding of shifting consumer needs and business agility will be essential to weather the storm.
The combined psychological impact of perceived job insecurity, elevated debt and higher prices could lead low and middle-income households to cut back on non-essential purchases and prioritize necessities.
Retailers that serve this demographic should remain more resilient as consumers trade down; after all, demand for everyday essentials (particularly food, beverages and household products) persists regardless of economic conditions. Within consumer staples, investment grade-rated warehouse clubs (like BJ’s and Costco), discount retailers and dollar stores (including Walmart and Dollar Tree) are well positioned to weather a consumer downturn. Within high yield, we view non-discretionary sectors including grocery chains (like Albertsons) and food companies (including Post, Lamb Weston and Bellring Brands) as robust countercyclical positions.
The environment is one of heightened caution and uncertainty for the more cyclical consumer discretionary sector, however, particularly for retailers catering to lower-income consumers. Overall, we are taking a cautious view of the US consumer sector and are watching balance sheets particularly closely. Among high yield issuers, several lower quality single ‘B’ and triple ‘C’-rated retailers look overleveraged and have become dependent on free cash flow to service higher debt levels, with limited investment in their operations.
As we enter what could prove a challenging period for US consumers, we prefer issuers within this space that boast low debt leverage, strong operations and inventory management, and experienced management teams to navigate choppy economic conditions.
1 Lending Tree, April 2025: 2025 Credit Card Debt Statistics
2 Federal Reserve Bank of New York, February 2025: Center for Microeconomic Data: Household Debt and Credit Q42024
3 Lending Tree, 23 April 2025: BNPL Tracker: 41% of Users Late in Past Year, More Using Loans for Groceries
4 Federal Reserve Bank of New York, March 2025: Survey of Consumer Expectations
5 Federal Reserve Bank of New York, March 2025: Survey of Consumer Expectations
6 US Bureau of Labor Statistics, 4 April 2025
7 Marketplace and Chmura Economics & Analytics, March 2025: Each Federal Layoff Could Lead to At Least 1 Other Job Loss in the Private Sector
8 The Yale Budget Lab, 2 April 2025: Where We Stand: The Fiscal, Economic, and Distributional Effects of All U.S. Tariffs Enacted in 2025 Through April 2
9 ICE BofA US High Yield Index (BLASS Level 3 and 4 data)
References to specific securities are for illustrative purposes only and should not be considered as a recommendation to buy or sell. Nothing presented herein is intended to constitute investment advice and no investment decision should be made solely based on this information. Nothing presented should be construed as a recommendation to purchase or sell a particular type of security or follow any investment technique or strategy. Information presented herein reflects Impax Asset Management’s views at a particular time. Such views are subject to change at any point and Impax Asset Management shall not be obligated to provide any notice. Any forward-looking statements or forecasts are based on assumptions and actual results are expected to vary. While Impax Asset Management has used reasonable efforts to obtain information from reliable sources, we make no representations or warranties as to the accuracy, reliability or completeness of third-party information presented herein. No guarantee of investment performance is being provided and no inference to the contrary should be made.