
 United States
Semiconductor manufacturing is one of the highest value chokepoints in the global economy.
The industry is highly geographically concentrated in areas vulnerable to extreme weather.1 The physical climate risks facing plants are exacerbated by the energy and water intensity of the industry’s manufacturing, with operational tolerances that leave little margin for disruption.
Combining Jupiter Entity Modeling™ with Impax sector research, we find that climate modelled analysis quantifies physical risks for the largest chipmakers at as much as 9% of the value of semiconductor manufacturing assets by 2030.2 Almost all of this is a modelled insurance premium on acute risks from flooding, wildfires and storms. If chronic hazards like heat were included in these premium estimates, the figures would doubtless be higher.
Extreme heat presents risks that are harder to model, but that are clearly financially material for chipmakers – especially as they cannot be transferred to insurers. Some are more exposed than others, based on the location of their manufacturing facilities (known as ‘fabs’) and how geographically concentrated they are.
To fill in the gaps and understand how well chipmakers are managing these risks, we believe there is no substitute for effective company engagement and specialist sector knowledge.
The industry’s concentrated risks
A very small number of fabs account for a disproportionate share of advanced chip production.
One company, Taiwan Semiconductor Manufacturing (TSMC), alone accounts for around 90% of global production of leading-edge logic chips used in AI data centres, smartphones and high-performance computing.3 Production of its most advanced 3 nanometre (nm) and 5nm chips is currently located almost exclusively at its major Taiwanese facilities.
Fabs are among the most energy-intensive industrial facilities globally, with the largest consuming more electricity than car plants.4 Maintaining cleanroom conditions within very narrow temperature and humidity tolerances involves continuous cooling and air filtration systems.
The chipmaking process is also extremely water-intensive: a single fab can use an estimated 14bn litres of ultra-pure water each year to clean the silicon wafers placed in chips and to maintain a clean environment.5 This informs the geographic situation of many fabs. In Taiwan, for example, the reservoirs that feed Hsinchu, Taichung and Tainan are recharged by typhoon and monsoon rainfall – making the same weather system simultaneously a crucial supply of water and a threat to operations.
Interruption to production can cost chipmakers as much as US$2mn an hour (and potentially cascade across automotive, consumer electronics, defence and AI supply chains).6 TSMC’s temporary halt to operations in 2024 after the Hualien earthquake caused power outages and cost it an estimated US$60mn.7 To avoid disruption during Taiwan’s 2020-21 drought, the company resorted to trucking water to its plants.8
The 2026–27 El Niño event, which is expected to be particularly strong, may exacerbate physical risks across key semiconductor geographies, in different ways.9 In Taiwan and Oregon, for instance, El Niño typically suppresses the rainfall and snowpack (respectively) that fabs depend on for water inputs.10,11 In Arizona, the more acute risk is grid strain from extreme heat in summer, although this may be partly offset by El Niño’s typically wetter winters.
Extreme heat exposure is rising
Using Jupiter’s Entity Modeling, we evaluated asset-level physical climate risks across the semiconductor manufacturing sites of seven companies, including the largest pure-play foundries and integrated device manufacturers.12
We examined whether location-specific data could reveal exposure to extreme heat and other hazards that may be obscured at the company level, informing investment analysis and engagement priorities.13
Across fab locations, revenue-weighted exposure to severe hazards, overall, ranges from 25% to 100% of each company’s respective fab-related revenues (see chart below).
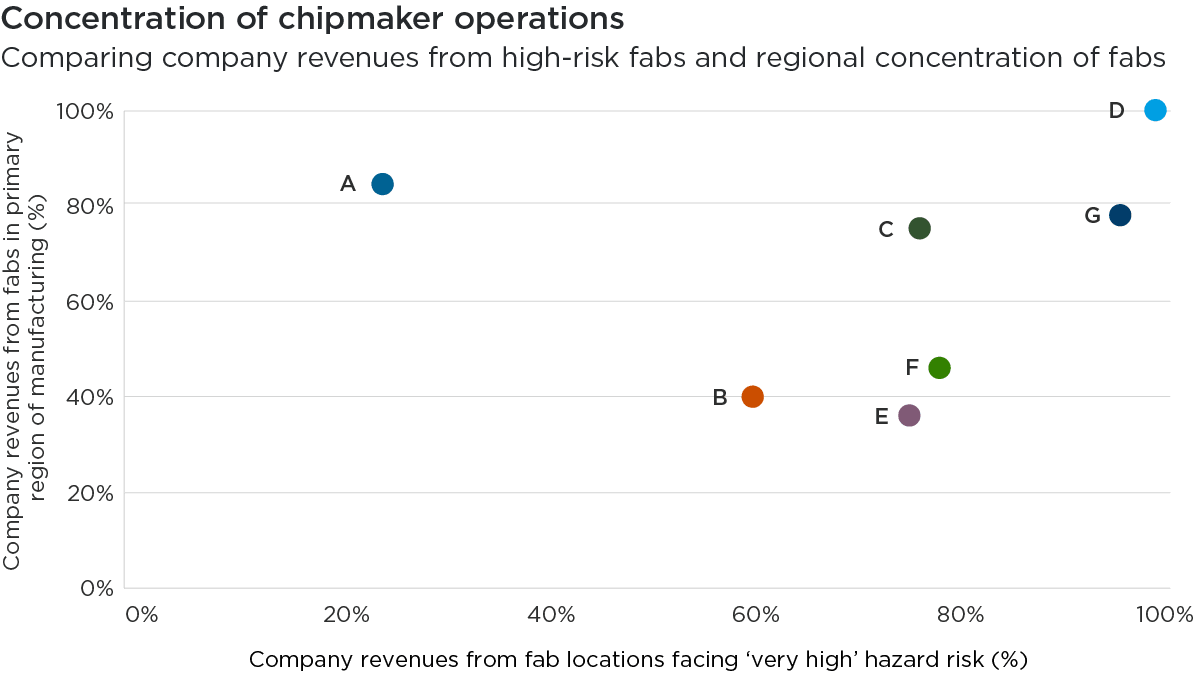
Source: Impax analysis using Jupiter data, August 2026
Concentration and exposure move together for six of the seven companies, but the driver is where critical manufacturing sites exist, not how concentrated a company’s assets are. Company A is the clearest exception: while its manufacturing is the second-most geographically concentrated (86% of fab revenues are generated in one region), it faces the lowest exposure to ‘very high’ hazard risks (25%).
The most widespread peril was extreme precipitation, with 56% of assets sitting in the ‘high’ or ‘very high’ hazard bands. This compares to 38% for extreme heat, 27% for drought and 17% for flood, respectively.14
Revenue-weighting narrows these gaps without changing the order: 46% of fab site revenue sits in the ‘high’ and ‘very high’ precipitation bands, against 39% for extreme heat and 22% for drought.
Extreme heat is the only peril whose revenue share exceeds its asset share, suggesting that heat-exposed sites are those that generate higher revenues, on average. Heat also shows the greatest increase in hazard risk levels: average heat stress across fab sites increases by half by 2050, and at some sites nearly doubles.15
The chart below shows the breakdown, by company, of fab revenues based on the heat hazards facing their locations. While the overall risks appear to be relatively low for Company A, for example, more than half of the fab revenues of two companies (C and F) are associated with sites exposed to ‘high’ or ‘very high’ heat risks.
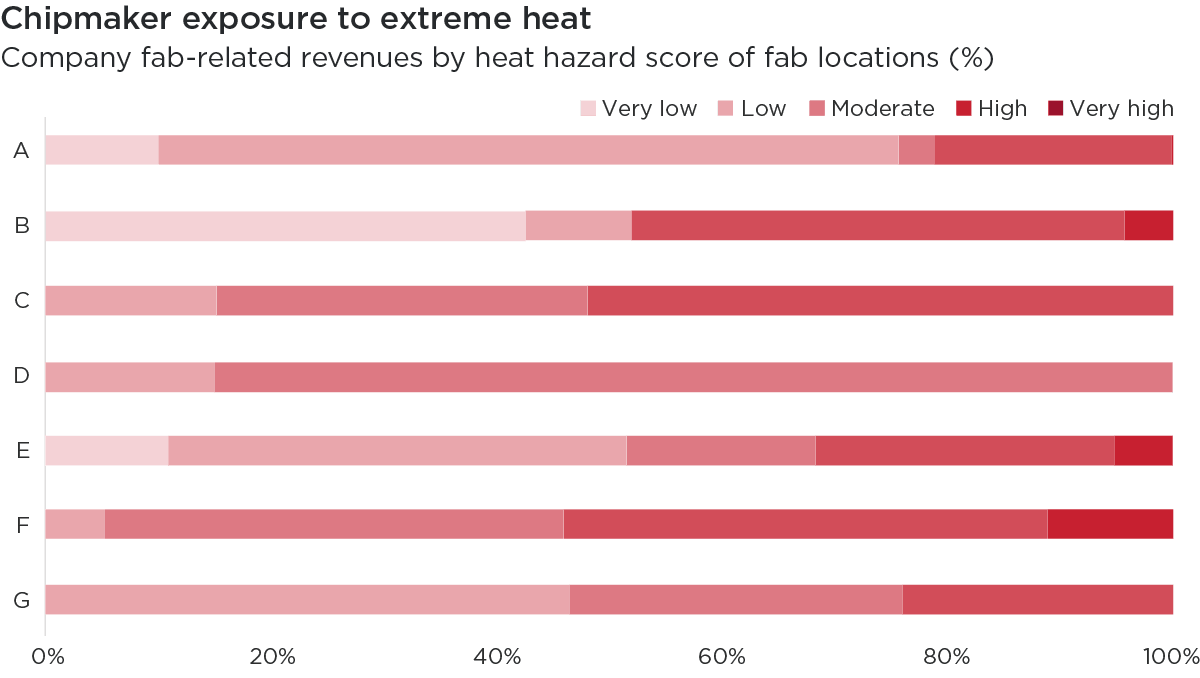
Source: Impax analysis using Jupiter data, August 2026
Heat risks are hard to model
Jupiter Entity Modeling translates physical climate risks into potential financial losses by 2030 for each of the largest semiconductor manufacturers that were the subject of our analysis.
The table below shows Jupiter’s estimated fab valuation impairments from all acute and chronic physical damages under a SSP2-4.5 climate scenario (where global emissions stay roughly flat to 2050), presented as a proportion.16 These typically range between 1% and 4% of companies’ respective property, plant, and equipment asset values, but are as high as 9% in one case.17
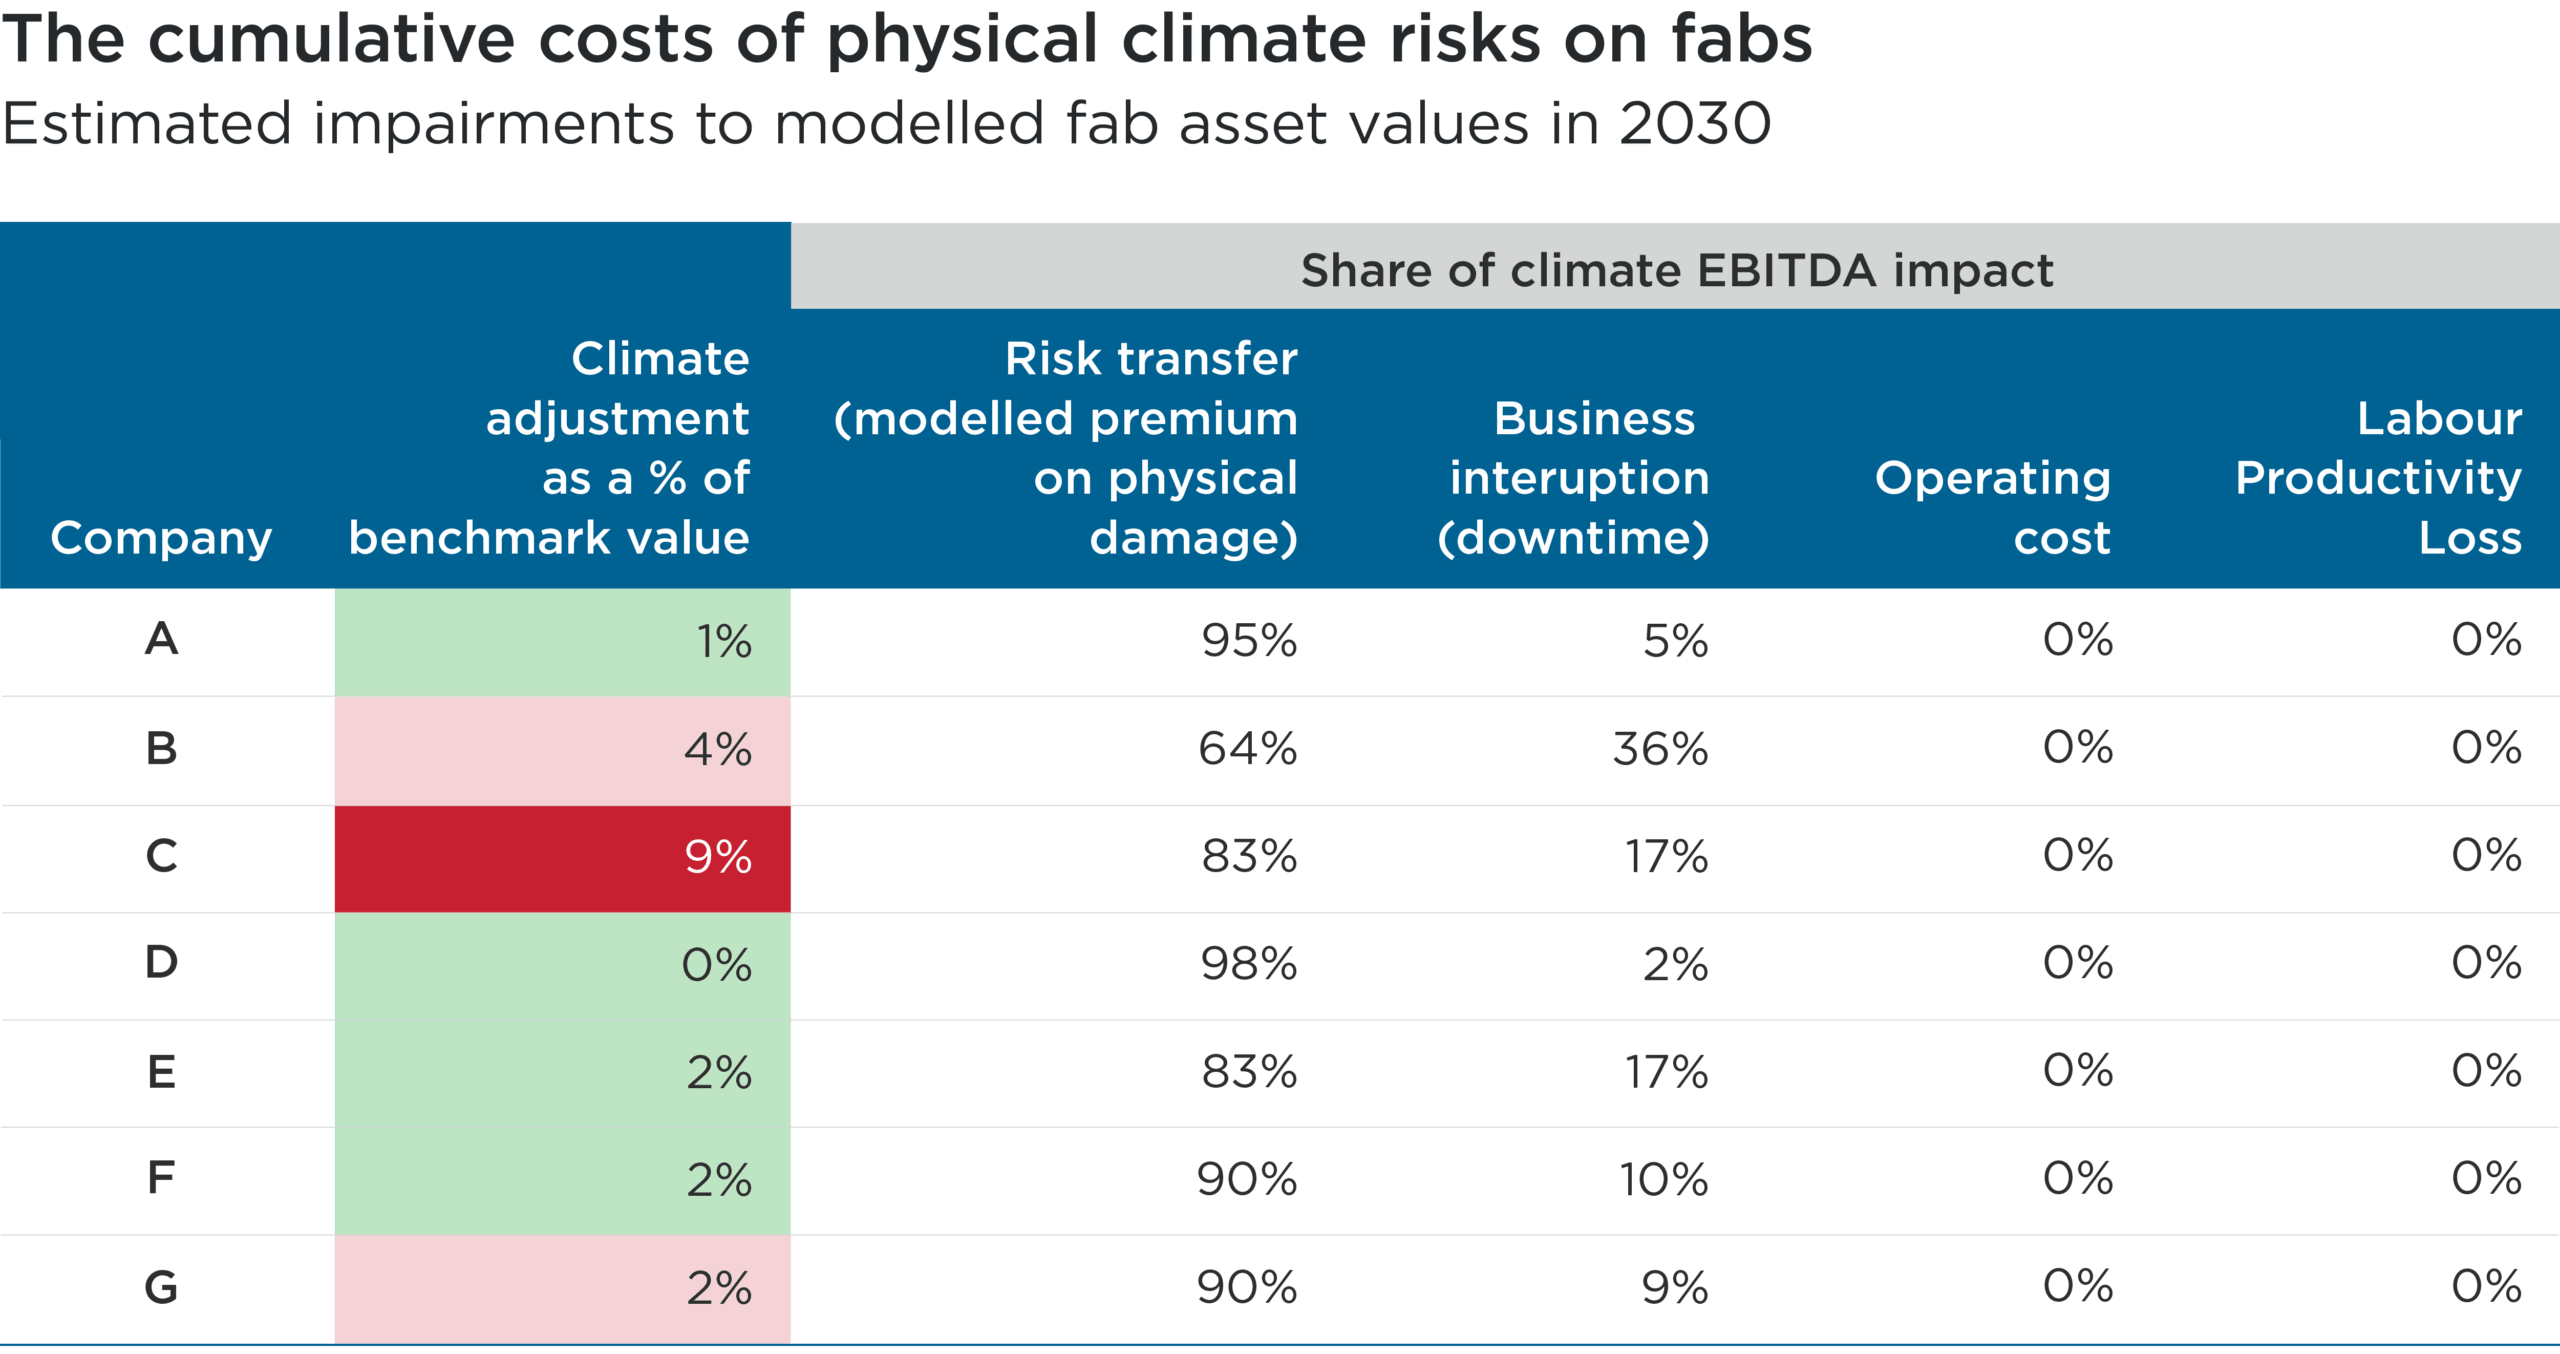
Source: Impax analysis using Jupiter data, August 2026
When these estimates are translated to annual company earnings (measured by EBITDA), the impacts are primarily driven by the rising cost of transferring the physical risks facing fabs to insurers (in the form of modelled insurance premiums).18 Premiums are modelled on average annual losses from floods, wildfires and wind (hurricanes and typhoons), with floods accounting for as much as 77% of estimated direct damages across companies.
In contrast, the modelled impacts of heat appear immaterial. Jupiter’s heat damage model captures only the cost from cooling electricity and assumes a climate-controlled environment for fabs with little productivity impact, with plans to capture heat-driven capex costs in future model updates. It does not capture impacts of extreme heat on grid curtailment or cooling system limits, leading to a likely underestimate of costs.19
Heat and water stress are easy to underestimate. Floods and storms produce discrete, insurable damage events. Heat and drought mostly do not, surfacing instead as recurring cooling and water-management costs, reduced productivity and interrupted production.
Where heat and drought are insured at all (for example in crop, subsidence or wildfire coverage) it is largely through specialist or state-backed schemes, rather than the commercial market.
The heatmap below illustrates the relative present day heat hazard scores and modelled ‘downtime value’ – estimated annual revenue impact from business disruption – of fabs analysed by region.
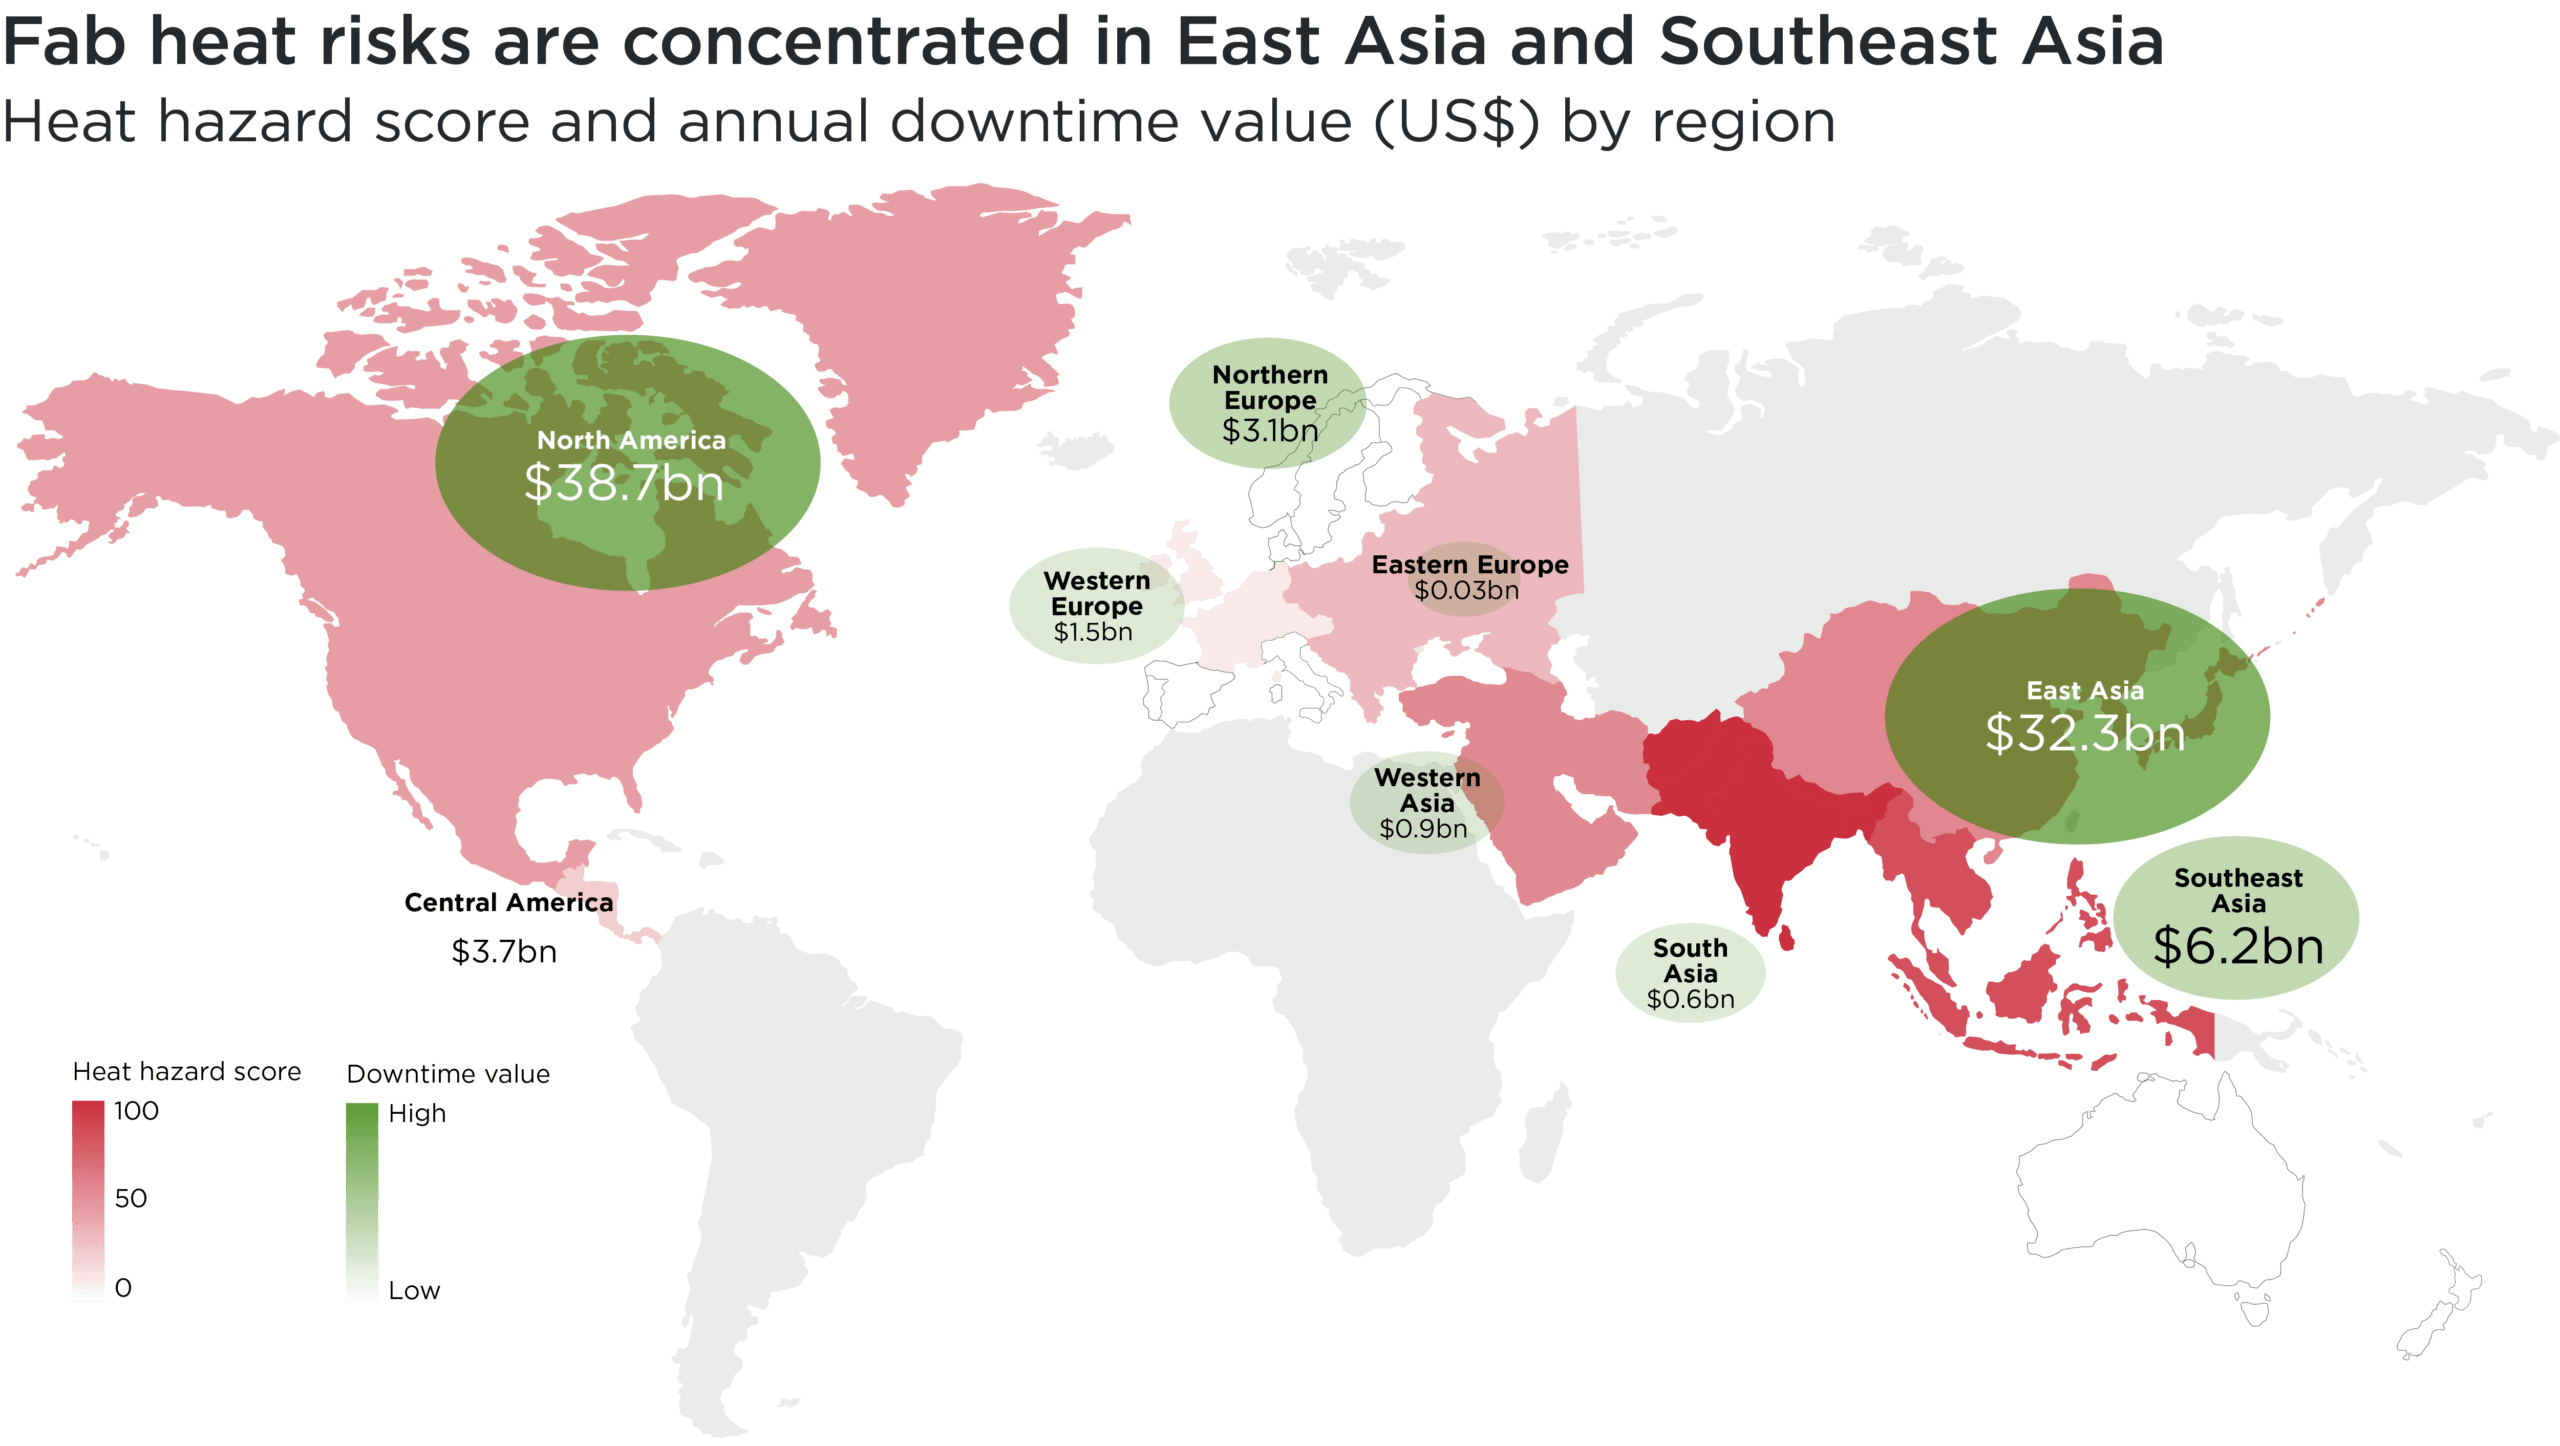
Source: Impax analysis using Jupiter data, August 2026. Downtime values are the modelled annual revenue impacts from disruption to fab operations.
Extreme heat tests tight parameters
Extreme heat can test and occasionally breach the narrow temperature and humidity ranges within which lithography – the process of printing circuit patterns onto silicon – operates.20
Products can be ruined by cleanroom temperatures deviating by only a fraction of a degree. Last year, TSMC had to scrap thousands of wafers following a power outage at an Arizona plant.21 Since a leading-edge chip takes three to four months to make, a stoppage – triggered by as little as power disturbances lasting milliseconds – can destroy much of the work on the line.22,23
Thresholds are likely to be crossed more often than independent hazard modelling implies as the triggers for tolerance breaches will typically arrive together when temperatures soar and engineered margins are eroded. Air conditioning systems draw most power just as grid reserve margins are tightest, and cooling towers use most water just as drought restrictions bind. Tolerance breaches occur when a fault coincides with a day when there is no spare grid or water capacity.
The risks of a cascade effect are, counterintuitively, well illustrated by the extreme low temperatures in Texas in 2021 that led to failures in the electricity grid and municipal water supplies. Fabs operated in the state by Samsung, NXP and Infineon all suffered shutdowns and consequent lost revenues from scrapped work-in-progress.24,25,26,27 None of the damage was insurable.
When evaluating these risks, what matters is not how much cooling a fab needs on an average day, but how often conditions exceed what its cooling plant was built to handle. Humidity is often the binding constraint, with a humid day straining a cooling tower’s capacity more than a hotter dry day. Impacts vary by fab, depending on the local extremes it was designed against and any spare capacity added since. Only the companies themselves can tell us where those design limits sit.
The chart below illustrates how two fabs can have a near-identical number of ‘cooling degree days’ – a metric of how much cooling a building needs over a year – but highly divergent numbers of days experiencing extreme heat relative to historical levels. Comparing the highlighted examples demonstrates this point.
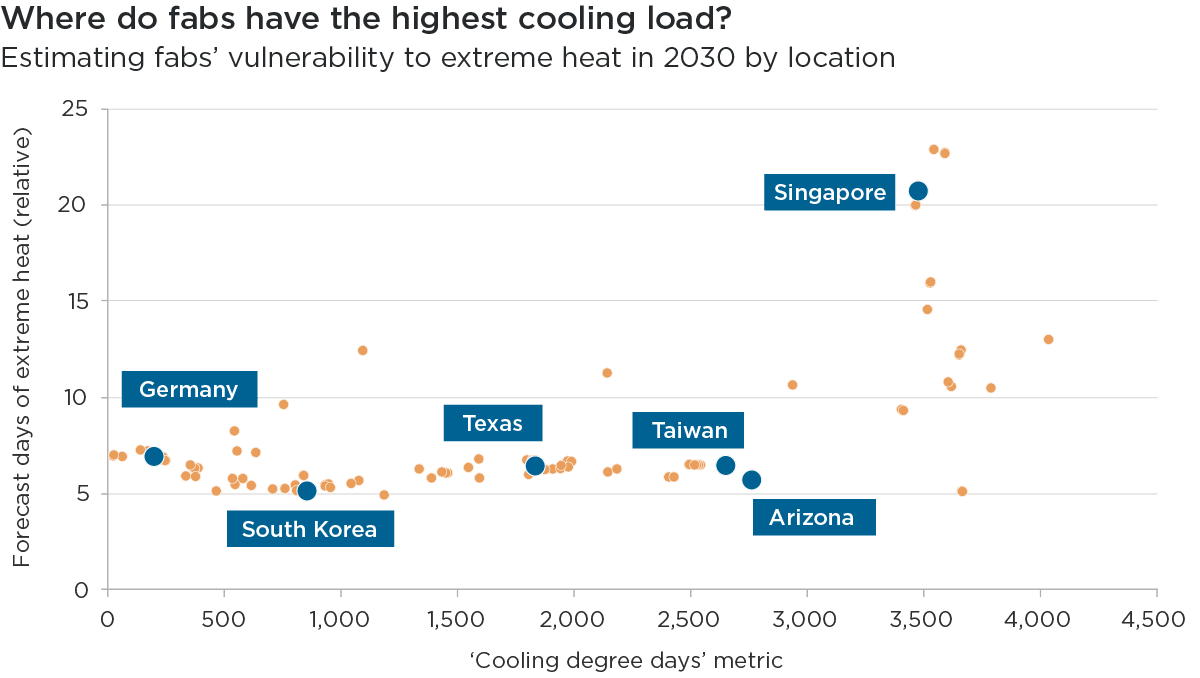
Source: Impax analysis using Jupiter data, August 2026. “Forecast days of extreme heat (relative)” is an estimate of days exceeding the local historical (1980-2010) 99th percentile high temperature. Calculations are based on a SSP2-4.5 climate scenario (where global emissions stay roughly flat to 2050).
Engaging to understand heat risk management
As financial risks rise from extreme heat and other hazards, climate adaptation and resilience planning (and progress) can become a key determinant of long-term company performance.
Company-level analysis can test the rigour of a company’s risk assessment and the measures it is taking to address the most material risks it may face.
Among chipmakers analysed in our research, Texas Instruments leads on the quantification of risks from extreme heat, identifying it as a major source of business interruption that it estimates will give rise to a US$202mn expected annual loss in 2050.28 Meanwhile, we perceive German competitor Infineon to be a leader on process, evaluating risks of heatwaves at a site level – and finding them financially material.29
In both cases, the companies only discuss the steps that they are taking to reduce these risks at a high level, however. Many of the factors influencing how heat impacts a company’s fabs are unpublished.
We believe that engagement is therefore essential for investors to gain a more informed picture of investment risk and corporate resilience as it pertains to extreme heat.
Engagement with companies is needed, for instance, to establish the wet-bulb temperatures that an individual cooling plant was specified to and the spare cooling capacity held at sites facing rapid shifts in extreme heat.
No company covered in this analysis appears to treat heat as a constraint on cleanroom humidity control. Whether that reflects genuine headroom or an unexamined risk is worth discussing with management, in our view.
A proof of concept
This analysis is the first phase of a broader physical climate risk research programme at Impax. Its findings will be used to identify engagement opportunities.
This case study is a proof-of-concept for an asset-level approach that can extend beyond semiconductors to other exposed sectors. It is our conviction that integrating physical risk data with sector-specific transmission channels will enable better-informed investment decisions.
The next phase of our research will focus on water stress as a driver of operational costs and operational disruption, exploring solutions to the challenge of forecasting local water prices.
1 This geographic concentration stems from the cost benefits of resource agglomeration, policy conditions set in the 1970s and 1980s to incentivise manufacturing, and the physical characteristics of sites, principally the need for continuous high-volume water, which locates fabs near the reservoir and municipal systems serving major coastal and valley population centres.
2 For more details on Jupiter Entity ModelingTM, see https://www.jupiterintel.com/products/entity-modeling
3 Klingler-Vidra, R., April 2026: How Taiwan came to dominate the global chip industry. The Conversation
4 Schneider Electric, 2021: How to improve power reliability for semiconductor fabs
5 World Economic Forum, 2025: Nature Positive: Role of the Technology Sector
6 Schneider Electric, 2026: Why is power quality so critical in semiconductor fabs?
7 Rogelberg, S., TSMC shrugs off Taiwan’s biggest earthquake in 25 years, showing its massive chip foundry mega-complexes are nearly quake-proof. Fortune
8 Flaherty, N., 2 March 2021: TSMC, UMC use water tankers in Taiwan drought, EE News Europe
9 World Meteorological Organization, 3 September 2026: El Niño set to become very strong, raising risks of extreme weather into 2027
10 Huang, W-R., Chang, Y-H. & Huang, P-H., 2019: Relationship between the Interannual Variations of Summer Convective Afternoon Rainfall Activity in Taiwan and SSTA (Niño3.4) during 1961–2012: Characteristics and Mechanisms. Scientific Reports
11 Baumhardt, A., 23 June 2026: Northwest potentially in for ‘one of the strongest El Niños we’ve had,’ climatologists say. Oregon Capital Chronicle
12 The seven companies analysed as part of this study were Infineon Technologies, Intel, Micron Technology, Samsung Electronics, SK Hynix, Texas Instruments and TSMC
13 The dataset does not distinguish between front-end fabrication and back-end test-and-assembly sites, or between leading-edge and less advanced manufacturing facilities. These are important limitations because sites differ materially in their strategic importance, operational sensitivity and financial contribution; incorporating these distinctions is therefore a priority for future analysis.
14 For each location and peril, Jupiter calculates a present day (2020) hazard score from 0 – 100 scale which maps raw peril metrics onto a comparable index. The raw peril metric and therefore relative 0-100 mapping differs for each peril and is calculated relative to the Jupiter global asset distribution. These scores are converted into bands: ‘very low’ (0 – 20 hazard score), ‘low’ (21 – 40), ‘moderate’ (41 – 60), ‘high’ (61 – 80), ‘very high’ (81 – 100).
15 This is based on Jupiter’s hazard change scores, which measure the level of change between the present-day hazard year and 2050 for each site. Change scores seek to quantify whether changes are substantial compared to a baseline period.
16 Valuation impairment is based on the four impact channels used to calculate EBITDA impacts (insurance costs, overheads, productivity, downtime), projecting that annual impact forward 10 years and discounting it back to a present value. Value erosion is calculated a percentage of the companies’ respective property, plant, and equipment asset values. The table reflects forecasts impairment for fab manufacturing sites in 2030 under a SSP2-4.5 scenario.
17 SSP2-4.5 assumes no dramatic change from the status quo: countries continue on their current direction of travel, with emissions staying roughly flat until around 2050 before gradually declining, rather than accelerating sharply in either direction. On that path the world is likely to be around 2.7°C warmer by the end of the century than in pre-industrial times — well above the Paris Agreement’s goals, and enough to drive materially higher physical risk.
18 EBITDA represents company earnings before interest, debt, depreciation and amortisation
19 Jupiter’s Heat Loss metric quantifies incremental cooling energy demand from air-conditioning loads, calibrated against general building stock. However, fab cooling is driven by the huge volumes of outside air that must be continuously drawn in, dried and chilled to hold the cleanroom’s tight temperature and humidity tolerances, rather than by keeping people comfortable. The model also applies default occupancy assumptions, groups front-end and back-end sites despite materially different cooling loads and tolerance requirements, and holds operations and financial structure static. Extreme heat is highly localised in ways gridded models struggle to resolve. Many of these bias toward understatement.
20 Cooling tower capacity is set by the ambient wet-bulb temperature, a combined measure of heat and humidity. As wet-bulb rises, towers shed less heat while the cooling required increases, since the outside air a fab continuously draws in must be chilled enough to strip moisture from it — so humid heat squeezes the plant from both sides, and a hot dry day is far less demanding. A fab is sized against a historical design wet-bulb: well within that margin the cost is energy and water, but as it narrows the plant holds conditions less precisely, and small variations within tolerance are enough to cost yield. Only at the extreme is the design limit exceeded outright.
21 Data Center Dynamics, 25 November 2025: TSMC scrapped thousands of wafers after power outage caused September shutdown
22 Exposure varies by process step: wafers in wet benches, furnaces, implanters or mid-planarisation are at risk of scrap or rework, while wafers held in stockers are generally unaffected. Leading-edge logic cycle times run to three to four months across more than 1,000 process steps.
23 The industry’s own equipment standard SEMI F47 requires processing, metrology and test equipment to operate without interruption through sags to 50% of nominal voltage for 200 milliseconds, 70% for 500 milliseconds, and 80% for one second. This was originally published in 2000 and now required by almost all fabs worldwide.
24 Jankowski, P., 16 February 2021: Austin Energy shuts off power to major industrial users. Austin American-Statesman
25 Jankowski, P., 1 March 2021: Nobody knew how to restore power at Ullrich Water Treatment Plant during the freeze. It was out for three hours. Austin American-Statesman
26 Samsung Electronics, 29 April 2021: Q1 2021 Earnings Call
27 NXP, March 2011: NXP Resumes Operations at Austin, Texas Facilities Following Weather-Related Shutdown and Provides Revenue Update
28 TI, 2025: Climate change scenario analysis
29 Infineon, 2025: Sustainability at Infineon
References to specific securities are for illustrative purposes only and should not be considered as a recommendation to buy or sell. Nothing presented herein is intended to constitute investment advice and no investment decision should be made solely based on this information. Nothing presented should be construed as a recommendation to purchase or sell a particular type of security or follow any investment technique or strategy. Information presented herein reflects Impax Asset Management’s views at a particular time. Such views are subject to change at any point and Impax Asset Management shall not be obligated to provide any notice. Any forward-looking statements or forecasts are based on assumptions and actual results are expected to vary. While Impax Asset Management has used reasonable efforts to obtain information from reliable sources, we make no representations or warranties as to the accuracy, reliability or completeness of third-party information presented herein. No guarantee of investment performance is being provided and no inference to the contrary should be made.