 United States
When President Trump announced new US tariffs on imported steel and aluminium in early 2025, it ushered in a sustained period of dislocation across global metals credit markets.
Issuers in the sector were indiscriminately sold off in the face of uncertainty, often irrespective of their exposure to the US market. This created relative value distortions, some of which remain into early 2026.
With credit fundamentals looking robust, we believe compelling risk-adjusted opportunities remain for selective credit investors in a sector critical to the transition to a more sustainable economy.
An indiscriminate bond sell-off
In February 2025, President Trump signed an executive order imposing a 25% tariff on imported steel and aluminium. This initial executive order, which also covered downstream derivative products, came into force in March 2025.
Credit investors took a broad-based, risk-off stance as they also digested the impacts of more wide-reaching tariff measures that followed on ‘Liberation Day’, on 2 April. Spreads widened across global metals as investors initially treated the sector as homogeneously exposed to US trade policy.1
In this context, we sought to identify issuers in the global metals sector that had minimal or zero US exposure, but whose spreads had widened materially to create compelling entry points.
Two areas stood out. First, pure-play miners operating in local or regional markets, with no direct sales into the US, faced little-to-no first-order tariff risk. Second, higher-quality downstream and specialist metal producers that typically benefit from contractual pricing mechanisms and structural inflation pass-throughs, materially dampening any indirect tariff effects.
Spreads have tightened, but opportunities remain
Spreads inevitably began to mean-revert towards fundamentals as investors digested the precise scope, exemptions and economic transmission channels of the new tariff regime.2 This normalisation was further reinforced by a historic commodity price backdrop, driven by accelerating infrastructure investment and structural shortages of certain metals. The price of copper – which is essential to grid expansions, electric vehicles and data centres – rose by roughly 40% in 2025, for example.3
Below is a chart comparing the total returns of two model portfolios constructed by Impax since January 2025. The blue line shows the performance of companies with meaningful exposure to the US market (the “US” portfolio), and the orange line, the “Ex-US” portfolio, shows performance of companies with zero and near-zero exposure to the US.4 The chart ultimately highlights how the latter materially outperformed US-exposed issuers, despite an outsized drawdown post-Liberation Day.
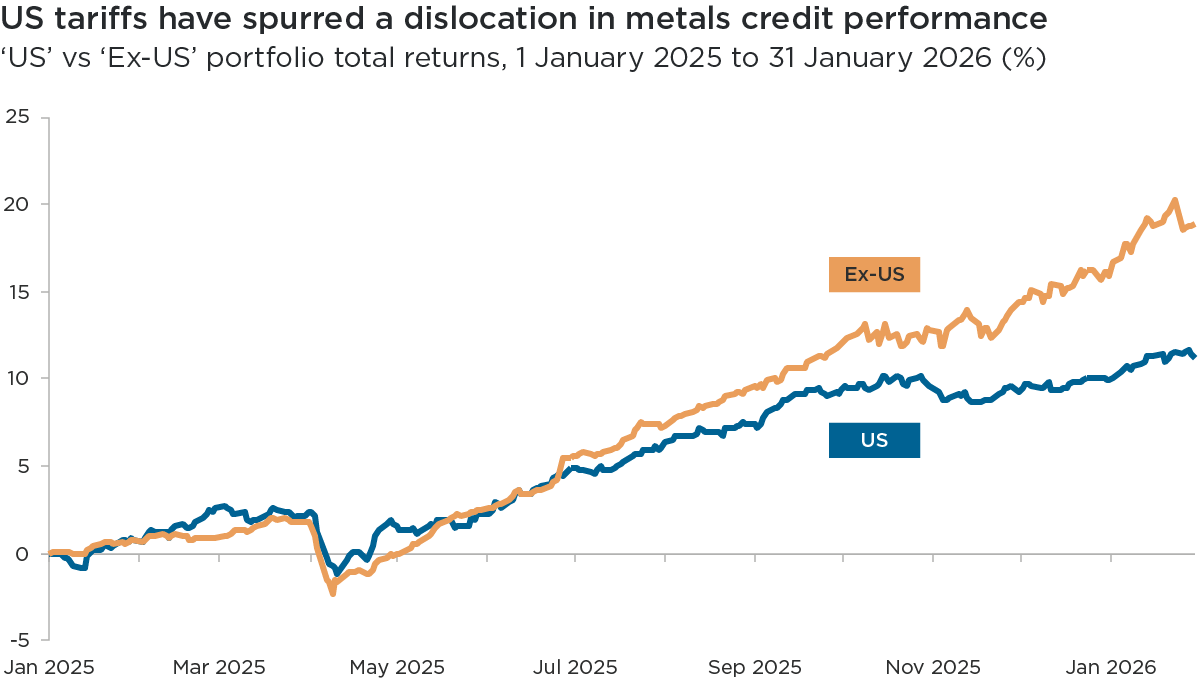
Past performance is not indicative of future returns.
Source: Impax analysis of Bloomberg data, 31 January 2026.
The ‘US’ portfolio is composed of metals and mining issuers with meaningful exposure to the US market.
The ‘Ex-US’ portfolio is composed of metals and mining issuers with zero and near-zero exposure to the US.
Both model portfolios have been defined by Impax, based on individual issuers’ revenue mix by geography.
Subhead: ‘US’ vs ‘Ex-US’ portfolio total returns, 1 January 2025 to 31 January 2026 (%)
Overview: This line chart shows the performance of two model portfolios, composed of metals and mining issuers, between the start of 2025 and the end of January 2026. The blue ‘US’ portfolio is composed of issuers with meaningful exposure to the US market. The orange ‘Ex-US’ portfolio is composed of issuers with zero and near-zero exposure to the US. Both model portfolios have been defined by Impax, based on individual issuers’ revenue mix by geography.
Overall, this chart highlights how the ‘Ex-US’ cohort of issuers has outperformed the ‘US’ cohort having initially sold off in April 2025 following the announcement of US ‘Liberation Day’ tariffs.
Given the breadth of the investible universe across credit qualities and maturities, and the introduction of certain biases with respect to implementation of weightings, it is imperative to not only evaluate the model portfolios from a total return lens, which may obscure true relative value signals.
The group of issuers that we classify as having (near) zero US exposure is skewed towards smaller, single or limited-site operators that are positioned higher in the value chain, and have greater operational footprints outside the US and Europe. Among this cohort, there are issuers that still trade at premium levels: yields are higher, despite their lack of exposure to US tariffs.5
In our analysis, we identified a clear divergence in spreads between this cohort and US-exposed issuers. Through end-October, the “Ex-US” portfolio’s aggregate option-adjusted spread (OAS) had widened meaningfully while that of the “US” portfolio tightened – not accurately reflecting the “Ex-US” issuers’ individual credit risk. These changes expanded the OAS ratio between the two cohorts, signalling a continued valuation gap that was actively lagging an increasingly hot commodities backdrop. In the final two months of 2025, we saw both portfolios’ technicals begin to perform in a manner more reflective of genuine credit compression than broader market drivers.
A positive backdrop, supported by electrification and AI
Looking further into 2026, the commodities backdrop remains broadly positive. While the industry faces certain technological and labour challenges, as well as uncertainty over forward pricing, global metal prices are supported in the near-term by continued supply disruptions, long project lead times and seemingly insatiable demand related to the electrification of the global economy and expanding digital infrastructure.
Credit fundamentals are also improving, with several issuers entering a period of natural deleveraging, having also recently completed capital-intensive investment cycles. We observe that these dynamics are particularly pronounced among smaller and mid-sized issuers in emerging markets whose operating assets are also domiciled in creditor-friendly jurisdictions.
Recognising this favourable environment, our analysis finds that these credits continue to screen positively for compelling risk-adjusted opportunities aligned with investing in the transition to a more sustainable economy.
1 Bloomberg data, 31 January 2026
2 Bloomberg data, 31 January 2026
3 Bloomberg data, 31 January 2026
4 Model portfolios based on Impax calculations, 31 Jan 2026
5 Impax analysis of Bloomberg data, 31 January 2026
References to specific securities are for illustrative purposes only and should not be considered as a recommendation to buy or sell. Nothing presented herein is intended to constitute investment advice and no investment decision should be made solely based on this information. Nothing presented should be construed as a recommendation to purchase or sell a particular type of security or follow any investment technique or strategy. Information presented herein reflects Impax Asset Management’s views at a particular time. Such views are subject to change at any point and Impax Asset Management shall not be obligated to provide any notice. Any forward-looking statements or forecasts are based on assumptions and actual results are expected to vary. While Impax Asset Management has used reasonable efforts to obtain information from reliable sources, we make no representations or warranties as to the accuracy, reliability or completeness of third-party information presented herein. No guarantee of investment performance is being provided and no inference to the contrary should be made.