 United States
When US investors consider regional equities allocations, two key benchmarks often take center stage: the S&P 500 Index of large-cap US equities and the MSCI EAFE Index, representing developed markets outside North America.
While both indices capture the performance of blue-chip companies, their sector compositions are very different – and this can have a major impact on prospective investment returns.
By strategically tilting EAFE exposure towards growth-oriented sectors, which EAFE has historically been underexposed to, we believe that investors can potentially unlock better performance while preserving the diversification benefits of investing internationally.
Source: Bloomberg data, as at 30 June 2025
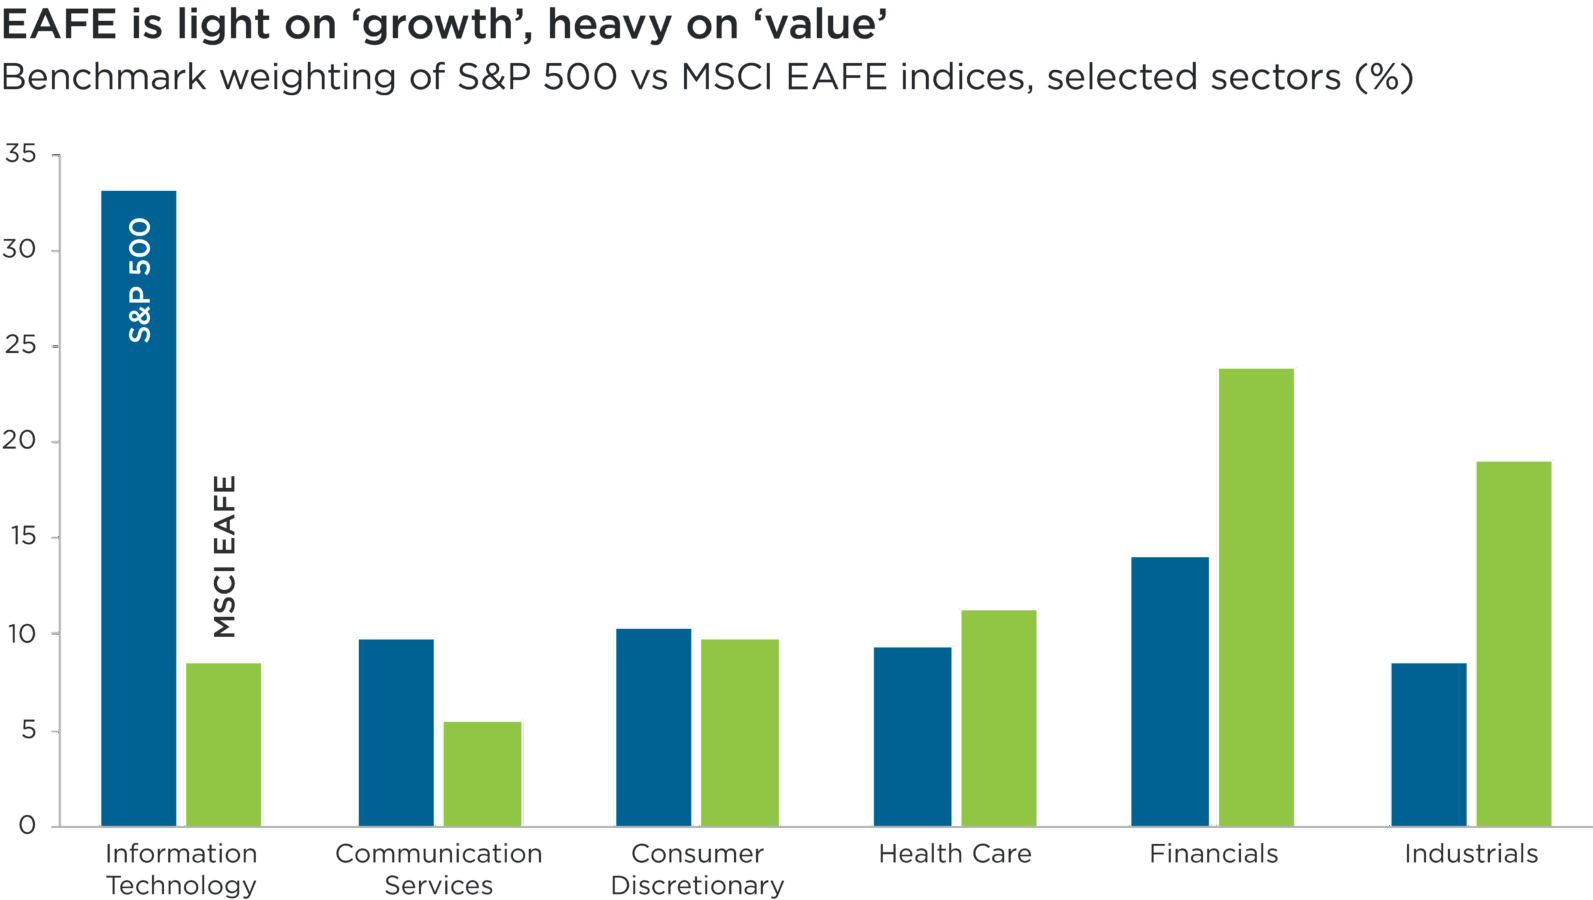
Subhead: Benchmark weighting of S&P 500 vs MSCI EAFE indices, selected sectors (%)
Overview: This bar chart compares the sector breakdown of the S&P 500 Index of US equities and the MSCI EAFE Index of ex-North American developed market equities, as at 30 June 2025. It includes six sectors: Information Technology, Communication Services, Consumer Discretionary, Health Care, Financials and Industrials.
Overall, this chart highlights how the MSCI EAFE index is significantly underweight to the Information Technology sector, versus the S&P 500. It also shows how the EAFE has meaningfully larger relative exposure to the Financials and Industrials sectors, versus the S&P 500.
EAFE’s structural underweight to growth
The S&P 500 has been skewed towards growth-oriented sectors for years, driven by US companies’ dominance of the global technology sector. Today, the technology sector accounts for one-third of the US index’s weighting.1
Over the past decade, the dominance of the ‘Magnificent Seven’ and other US tech leaders has been a primary driver of the S&P 500’s strong outperformance over the EAFE, which is anchored in industrials, financials and materials.2 While these sectors are normally expected to perform better in stable or value-driven market cycles, they have typically lagged during innovation-led bull markets.
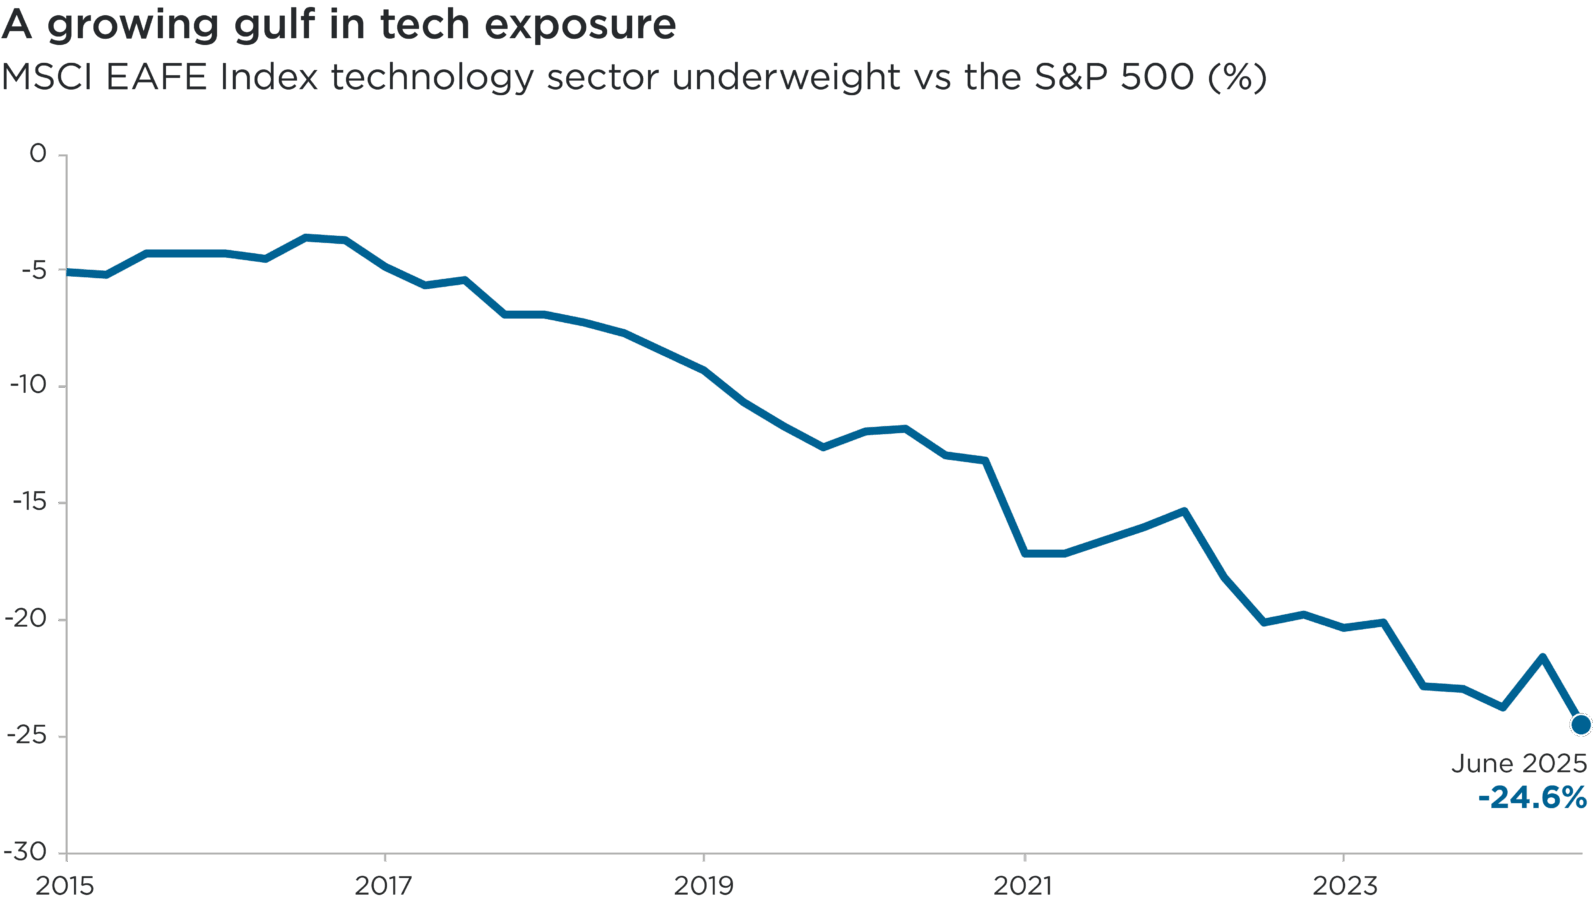
The technology sector’s long-term outperformance – combined with secular growth trends in digitalization, artificial intelligence (AI) and biotechnology – has left the EAFE structurally underweight to the fastest-growing parts of the global equities market. The difference between the index’s respective weightings to technology has expanded to 25 percentage points, up from only five percentage points as recently as 2018 (see below).3
Source: Bloomberg data, as at 30 June 2025
Subhead: MSCI EAFE Index technology sector underweight vs the S&P 500 (%)
Overview: This line chart shows the relative weighting of the MSCI EAFE Index to the Information Technology sector, versus that of the S&P 500 Index, from the end of 2015 to 30 June 2025.
Overall, this chart illustrates how the MSCI EAFE index’s underweight exposure to the Information Technology sector, versus the S&P 500, has grown over the past decade. As at 30 June 2025, the gap stood at 24.6 percentage points, up from 5.1 percentage points at the end of 2015.
The case for systematically skewing EAFE to growth
Investors looking to ensure that their international equities allocations have more exposure to the fastest-growing sectors of the economy, without abandoning geographical diversification, could consider shifting their EAFE allocations away from the benchmark.
We expect addressable markets in digital infrastructure, resource efficiency, healthcare innovation and access to finance to grow faster than the global economy at-large.
For this reason, the Impax Sustainability Lens focuses on sub-industries that are exposed to these drivers of the next economy.4 Its application to the universe of ex-North American developed market equities tilts the profile of an EAFE portfolio in five ways.
- Higher allocation to technology: the Lens adds exposure to European and Asian tech leaders in semiconductors, software and digital services.
- Higher allocation to healthcare: the Lens highlights global pharmaceutical, biotechnology and medical technology companies with strong research and development pipelines.
- Selective exposure to consumer discretionary: the Lens looks to capture innovation-driven consumer and luxury goods brands with global demand.
- Higher allocation to communication services: the Lens highlights global telecommunications, media, streaming and digital platform companies.
- A tilt towards higher-growth industrials: the Lens focuses on innovative European and Asian companies that are solving challenges around energy and resource efficiency.
We believe that applying the Impax Sustainability Lens to the EAFE universe confers three potential benefits for portfolios.
First, it closes the gap in exposure to ‘growth’ sectors, versus the S&P 500. A growth tilt can better align EAFE portfolios with the structural drivers of global equities markets.
Second, it better positions EAFE portfolios to capture the potential of secular trends including digital transformation, health innovation and consumer premiumization. After all, these are global – not just US – stories.
Third, it balances the EAFE index’s value bias. Adding ‘growth’ exposure can reduce any performance drag (relative to the S&P 500) in technology-led bull markets, without sacrificing valuation discipline.
Tilting the EAFE universe in this way does not, importantly, materially undermine the diversification benefits of allocations to ex-US equities. Based on our analysis, portfolio correlations with the S&P 500 remain low.5
While the US has been the global leader in many emerging technologies, there are plenty of opportunities across other developed markets to access innovation at attractive valuations. We believe that applying the Sustainability Lens to the EAFE universe can help identify these opportunities among European and Asian stocks, while maintaining diversification to US large cap equities.
1 S&P Dow Jones Indices, as at 29 August 2025
2 MSCI, as at 29 August 2025
3 Bloomberg data, as at 30 June 2025
4 The Impax Sustainability Lens is a proprietary investment tool that is used to assess economic opportunities and risks associated with the transition to a more sustainable economy, in order to help our portfolio managers weight their portfolios toward sub-industries that we believe offer higher opportunity and lower risk. See further details below.
5 Impax analysis, August 2025
Nothing presented herein is intended to constitute investment advice and no investment decision should be made solely based on this information. Nothing presented should be construed as a recommendation to purchase or sell a particular type of security or follow any investment technique or strategy. Information presented herein reflects Impax Asset Management’s views at a particular time. Such views are subject to change at any point and Impax Asset Management shall not be obligated to provide any notice. Any forward-looking statements or forecasts are based on assumptions and actual results are expected to vary. While Impax Asset Management has used reasonable efforts to obtain information from reliable sources, we make no representations or warranties as to the accuracy, reliability or completeness of third-party information presented herein. No guarantee of investment performance is being provided and no inference to the contrary should be made.
Impax Sustainability Lens
The Impax Sustainability Lens is a proprietary investment tool that is used to assess economic opportunities and risks associated with the transition to a more sustainable economy, in order to help our portfolio managers weight their portfolios toward sub-industries that we believe offer higher opportunity and lower risk. Impax uses a combination of independent research (e.g., third party investment reports, academic studies, reports from non-governmental organizations, etc.) and proprietary internal research to aid their analysis. Qualitative or subjective aspects of the Lens process may include the selection of issues and indicators we believe are pertinent to a particular sub-industry, the determination of Opportunity and Risk categories, and making judgements about the efficacy of technologies or societal benefits that derive from various products and services. Limitations of the Lens methodology may include inadequate disclosure by or the availability of data about companies in certain sub-industries around issues that bear on Impax’s analysis of opportunity and risk. It is also possible that Impax’s opportunity and risk categories and analysis has not exhaustively identified all transition opportunities and risks, or has misjudged particular opportunities or risks, that may pertain in particular sub-industries. In addition, the Lens provides a top-down perspective about the typical opportunities and risks for companies by sub-industry; however, it does not evaluate to what extent a particular company is exposed to the opportunities or risks that the Lens suggests. The latter is done through bottom-up, fundamental company research that includes corporate resilience analysis.