 United States
Higher interest rates, regulatory changes and a steep drop in natural gas prices have combined to heap pressure on the solar industry in 2023. Companies operating in the important US residential solar market have been particularly hard-hit.
While the ‘rooftop revolution’ in household energy has been delayed by these setbacks, the fundamental drivers remain in place for long-term growth. Three interrelated shifts in the market – higher self-consumption of electricity by households, more battery attachments with solar systems, and the impetus of state regulatory reform – are well underway and will provide much needed support for the industry.
In this article, we explain these dynamics and identify where we believe they will create opportunities within the solar industry for innovative listed companies and their investors.
Shadows cast over a growing sector
Rising interest rates have had a substantial impact on the US residential solar market. Higher rates reduce consumer demand by raising the cost of financing home solar systems and, by extension, prolonging their payback period. Soaring labour costs – and so costs of installation – have further reduced the attractiveness of new rooftop systems.
Meanwhile, the cost of natural gas – the closest substitute for electricity in home heating and a primary determinant of wholesale electricity prices – is roughly half of what it was in late 2022.1
The market has also endured regulatory headwinds. While the Inflation Reduction Act (IRA) reduces the cost of equipment purchases, residential solar is as sensitive to state-level policies as it is to federal ones. Californian households, for example, have seen a radical change in the amount they are paid to export solar-generated electricity to the grid.2 New state regulations known as Net Energy Metering (NEM) 3.0 became effective in April 2023, and have cut the export price for new systems by 75%. California matters because it represents almost two-fifths of the US residential solar installed base.3 As a result, total US residential solar installations look likely to decline in 2024; not exactly what the industry was hoping for.
Deflated investors would do well to look at the bigger picture, which is one of exploding growth. China alone is on track to add around 180 GW of new solar power capacity by the end of 2023 (utility-scale and distributed combined). That’s up more than 100% from last year. The US is equally on track to double last year’s installations.4 And with capital now flowing into its domestic solar module manufacturing sector, the US could become self-sufficient in solar module production as early as 2025.5
In Europe, Russia’s invasion of Ukraine and unprecedented surges in grid electricity prices seem to have permanently increased the appetite for energy independence. Even so, European solar panel makers have faced the challenge of destocking in the wake of Chinese manufacturers dumping an estimated 40GW of excess inventory (equivalent to a year’s worth of installations) into the market.6
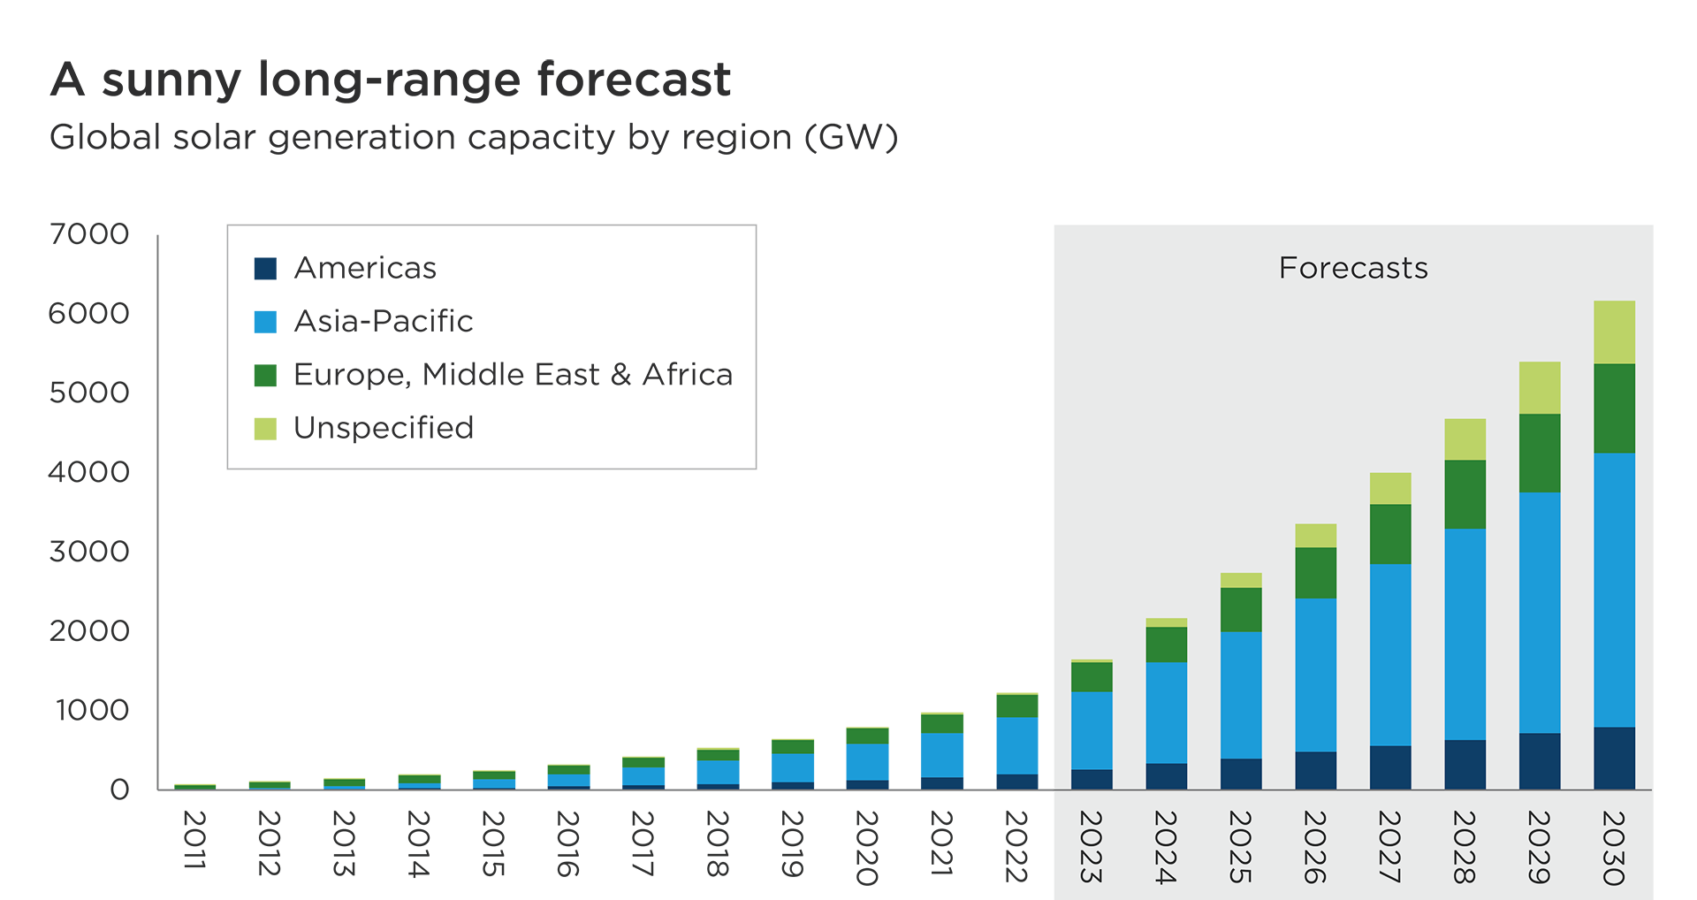
Chart Subtitle: Global solar generation capacity by region (GW)
Overview
This bar chart shows the growth of global solar electricity generation capacity between 2011 and 2030, in gigawatts. It’s broken down into four geographical categories.
Category one: Americas
Category two: Asia-Pacific
Category three: Europe, Middle East and Africa
Category four: Unspecified
Overall, global solar generation capacity grew 16-fold between 2011 and 2022, to 1,231 GW. It is forecast to expand five-fold again by 2030, to more than 6,000 GW. Most global solar generation capacity is – and is forecast to remain – in the Asia-Pacific region.
Values
Numerical values presented on the image:
| Year | Americas | Asia-Pacific | Europe, Middle-East and Africa | Unspecified |
|---|---|---|---|---|
| 2011 | 4.5 | 10.6 | 54.8 | 3.2 |
| 2012 | 8.3 | 18.6 | 74.1 | 3.8 |
| 2013 | 14.9 | 42.3 | 84.8 | 4.7 |
| 2014 | 23.9 | 69.2 | 93.0 | 6.8 |
| 2015 | 33.2 | 105.4 | 102.7 | 7.9 |
| 2016 | 48.9 | 153.4 | 111.2 | 10.8 |
| 2017 | 63.0 | 228.3 | 121.6 | 12.7 |
| 2018 | 77.6 | 299.6 | 137.3 | 17.6 |
| 2019 | 97.3 | 368.2 | 166.6 | 18.7 |
| 2020 | 124.3 | 460.1 | 193.2 | 19.1 |
| 2021 | 161.1 | 563.5 | 230.8 | 23.6 |
| 2022 | 204.2 | 711.1 | 284.0 | 31.8 |
| 2023 | 266.7 | 978.4 | 362.0 | 41.8 |
| 2024 | 333.9 | 1274.2 | 453.2 | 111.8 |
| 2025 | 405.4 | 1595.4 | 547.8 | 188.8 |
| 2026 | 481.2 | 1935.5 | 648.0 | 288.8 |
| 2027 | 559.2 | 2287.2 | 753.7 | 398.8 |
| 2028 | 639.1 | 2654.4 | 866.2 | 519.8 |
| 2029 | 717.9 | 3039.8 | 988.0 | 652.9 |
| 2030 | 801.4 | 3448.4 | 1121.6 | 799.3 |
Presentation
The bar chart illustrates the rise in global solar generation capacity, by region, over the 2011 to 2030 period.
Source: BloombergNEF, as of 18 August, 2023. End of year figures.
Structural drivers of the US ‘rooftop revolution’
Market imbalances in residential solar are symptomatic of a rapidly expanding industry supply chain that is desperately seeking some form of equilibrium. We see a recovery forming in the US residential solar market on the back of a market shift towards higher self-consumption, more battery pairings in home installations and state-level regulatory reform.
1. The trend towards higher self-consumption
Cost-competitive solar PV systems herald a new dawn for the relationship between households and the grid. Consumers have historically drawn electricity in one direction. Now, they have an opportunity to be both consumers and producers. Three interrelated drivers are setting the march towards higher self-consumption of electricity generated from roofs on US homes.
First, higher electricity prices have improved the economics of rooftop PV systems. Though residential electricity prices vary widely from state to state – residents of Massachusetts pay almost twice what Texans do, for example – prices have broadly ticked up quite sharply.7 Nationwide, the average price paid by households per kW rose by only 12% between 2010 and 2020. They have since risen by around one-fifth.8 Meanwhile, the costs of rooftop solar power have continued to fall.
Second, residential electricity consumption is rising as more households electrify their heating and transport. US sales of air-to-air heat pump grew by 11% in 2022, overtaking gas boiler sales.9 Meanwhile electric vehicle (EV) sales rose by 55% in 2022, accounting for 8% of all car sales.10 There is road left to run for US EV adoption to catch up with Europe, where more than one in five new cars sold is an EV.
Third, fiscal support incentivising the adoption of clean technologies should accelerate the adoption of residential solar PV over the coming decade, both directly and indirectly. The IRA offers a 30% tax credit to install solar panels until 2032. It also extends this tax credit for installing heat pumps, supporting the electrification of domestic energy use and the rationale for domestic generation.
2. The trend towards rising battery attachment rates
For the efficiencies of residential solar generation to be fully realised, the challenge of intermittent electricity production must be overcome through energy storage. Rising residential battery installations in the US serve as an important solution to this challenge.
The first driver is again the incentivisation of adoption through the IRA. Households can now receive an uncapped 30% tax credit for installing battery storage. Combined with the support outlined above, the payback period on new solar PV systems with battery attachment has been shortened by several years.
Second, it is not only the costs of generating solar electricity that have fallen dramatically – so too have the costs of storage. Even without subsidies, electricity storage costs have fallen exponentially with the roll out of technologies like lithium-ion batteries – and most recently with lithium vanadium phosphate batteries – and helped by lower global lithium prices.11
Third, the acceleration in rates of battery attachment in major European markets shows the direction of travel. In Germany, where more than 650,000 home storage systems have been installed, three-quarters of residential PV systems are now installed alongside battery packs.12
3. The impetus of state regulatory reform
‘Net metering’ consumer billing arrangements, which allow customers who generate their own solar power to sell unused electricity to the grid, have played a successful role in the roll-out of residential solar.13 California, an early adopter of net metering, now has more than 1.8mn solar installations and saw a record 2GW of new residential generation capacity added in 2022 – enough to power roughly 550,000 homes.14
For US residential solar, NEM 3.0 marks the beginning of a transition from net metering to higher battery attachment rates and greater reliance on self-consumption. As the largest single state market, California has typically set the standard for solar regulation across the US. Arizona has followed the Golden State’s lead in adjusting incentives for households, and some states are reevaluating their arrangements.15
Some states have refrained from changing net metering arrangements for now, citing inflation and elevated energy prices. Having vetoed legislation that would have imposed less favourable terms on consumers in 2022, Florida installed the second-highest number of residential PV systems in the first half of 2023.16
Bright rays of opportunity
The recent market sell-off is a reason to look again at companies operating in the US residential solar market. Several have quality business models with barriers to entry high enough to benefit from the industry’s long-term growth. Not every player in the market is succumbing to price competition arising from mass, low-cost Chinese manufacturing. Indeed, some companies are benefiting as lower prices for commoditised products increase aggregate solar demand, without the corresponding increase in supply for specialist components.
We are focused on interrogating niches in the solar industry where innovative companies have established dominant market share, for example by acting as the leading supplier for key components. We perceive opportunities for companies like Enphase Energy that offer a full home energy solution with smart module level inverters coupled with software, batteries, battery management and EV chargers. The US company, which focuses on the residential solar market, offers households an integrated closed ecosystem that we believe should result in high battery attachment rates and customer loyalty.
From a technology perspective, we prefer ancillary components (to commoditised panels) such as solar inverters and innovative electrical balance-of-system solutions. These effectively serve as the ‘brains’ of the system, converting solar energy into a usable output. SolarEdge is one of the leading producers of optimisers and inverters for US residential and commercial end markets and, alongside Enphase, is a large player in supplying integrated solar solutions to US households.
Although recent market sentiment towards many solar stocks has been deeply pessimistic, we believe selective long-term opportunities within the sector are being overlooked. The structural drivers for long-term growth of the US residential solar market remain firmly intact, boosting by initiatives like the IRA that are directing vast public and private investment into renewables, thanks to renewed government focus on energy independence and decarbonisation. Whatever the short-term forecast, we believe the future is bright for well-positioned companies in a rapidly expanding industry.
1 Henry Hub Natural Gas. Comparison is 30 September 2022 versus 30 September 2023
2 Kennedy, R., 4 Nov 2022: California set to release anti-rooftop solar net metering plan. PV Magazine
3 Solar Energy Industries Association / Wood Mackenzie Power & Renewables, September 2023: U.S. Solar Market Insight 2023 Q3
4 Bloomberg New Energy Finance, as of 31 October 2023
5 Rystad Energy, October 2023: Navigating the clean tech landscape: A year in review and a glimpse into 2024
6 Bellini, E. & Kennedy, R., 20 July 2023: European warehouses store 40 GW of unsold solar panels. PV Magazine
7 US Energy Information Administration, October 2023: Average Price of Electricity to Ultimate Customers by End-Use Sector, by State, August 2023
8 US Energy Information Administration, October 2023: Monthly Form EIA-861M – Revenue, sales, customer counts, and retail price by state and sector
9 IEA, 2023: Heat pumps
10 IEA, 2023: Global EV Outlook 2023
11 Schmidt, O., & Staffell, I., 2023: Monetizing Energy Storage – A toolkit to assess future cost and value.
12 PV Europe, March 2023: Energy storage systems make strong gains.
13 If a home is net-metered, the electricity meter will run backwards to provide a credit to be drawn down during periods when the home’s electricity use exceeds the solar system’s output. Customers are only billed for their net energy use.
14 Solar Energy Industries Association, 2023: Solar State by State
15 Plautz, J., 24 October 2023: State rooftop solar crackdowns cloud the industry’s future. EnergyWire
16 Wesoff, E., 15 September 2023: Florida is now adding more solar power than any other state. Canary Media
The specific securities identified and described are for informational purposes only and do not represent recommendations.
Nothing presented herein is intended to constitute investment advice and no investment decision should be made solely based on this information. Nothing presented should be construed as a recommendation to purchase or sell a particular type of security or follow any investment technique or strategy. Information presented herein reflects Impax Asset Management’s views at a particular time. Such views are subject to change at any point and Impax Asset Management shall not be obligated to provide any notice. Any forward-looking statements or forecasts are based on assumptions and actual results are expected to vary. While Impax Asset Management has used reasonable efforts to obtain information from reliable sources, we make no representations or warranties as to the accuracy, reliability or completeness of third-party information presented herein. No guarantee of investment performance is being provided and no inference to the contrary should be made.